Support and Resistance
When you first come to technical analysis, it may seem ridiculous that traders would invent an invisible foundation for a price decline or a barrier to a further rise, but that is exactly what support and resistance are. Support and resistance are core concepts in all trading, not just trading Forex, and have been around for over a century.
Support is an area under the current price, below which we do not expect traders to carry the price. It is formed by hand-drawing a line from a relative low in a price series to another relative low and then extending out into the future. In the example figure below, the red line connecting lows is a support line. We consider that when support is broken to the downside, it is a significant event that every trader can see and means the current trend is dead.
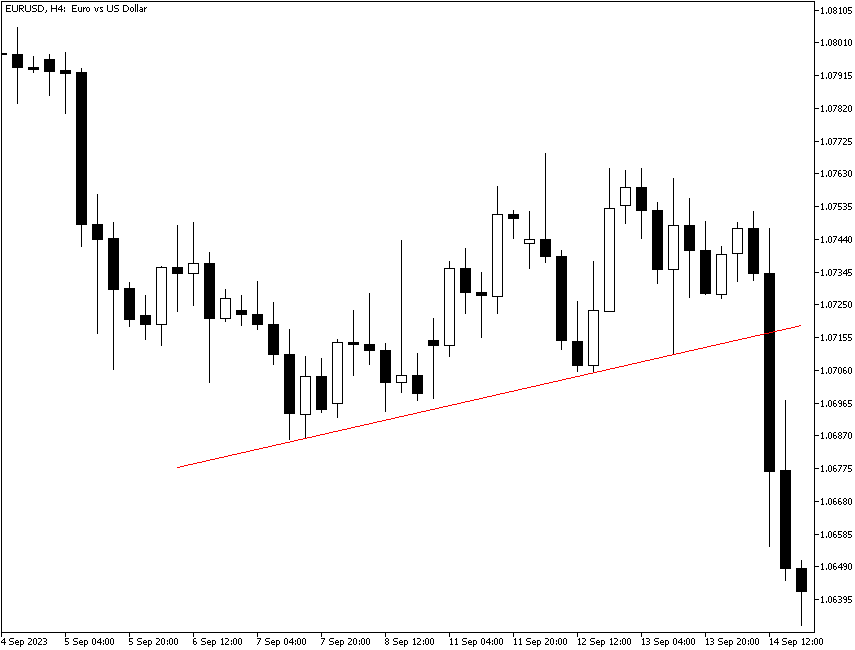
- As the price approaches the support line, we expect support to hold and, therefore, provide an excellent entry level.
- Once the price breaks support, we expect a series of lower lows and lower closes. We may want to go short.
- The trend may come back, but the existing support line has to be erased and a new one started. This is just one of many examples of when a “breakout” turns out to be sending a false message.
Resistance is an area above the current price, over which we do not expect traders to carry the price. It is formed by drawing a line connecting a relative high to another relative high and extending the line out by hand. Support and resistance lines often run parallel to each other, though this is not always the case, as in the example chart below. You can even have a support line slanting up while resistance slants downward, forming a triangle. You can read more on this in our lesson on Chart Patterns.
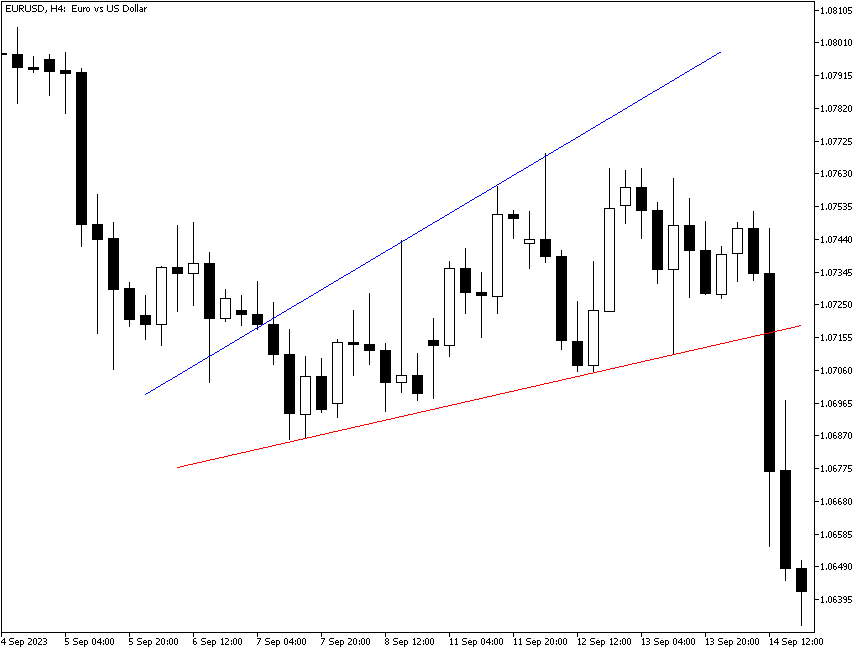
- The resistance line forms a limit on how high the currency price is likely to go. This is a useful number to have when you are planning a price target at which to take profit. To place a take-profit target higher than the resistance line would be unrealistic. If the profit you would make at or just below the resistance line is not enough to suit your wishes, you should not be in this trade.
- Resistance does sometimes get broken to the upside, and yet the price keeps going. Do not complain; just take advantage of the happy breakout. But be aware that breaking resistance can be a short-term development. You need to read the bars and consult other indicators to see where the move might be getting exhausted.
- It often happens that when you draw a support line, miraculously, you discover a parallel resistance line that connects highs. Nobody knows why the lines should be parallel, except possibly that the collective mind of the trading pool projects expected prices proportionately.
Why Does Support and Resistance Work?
The easy answer is that traders remember where they bought and sold in recent times, and the reasoning is that if it was good enough to buy at x, it’s good enough to buy at x+2 in a clear uptrend. You can apply the principles of supply and demand to support and resistance by saying that traders remember a surge at a similar price in the recent past and come together to form demand. Similarly, they remember that the last time a high that was z% above the average was met, the price stopped rising, and so their collective sell offers all near the same level constitute supply. This is not actually wrong, but it is silly. Support and resistance lines work because traders remember significant levels and they can draw lines. To get the same lines, though, traders must follow the same rules for determining significant levels.
Having said that, a line is an artificial construct added to the chart, and not everyone will obey it. It can be more accurate to say “support and resistance areas” than to rely on a single data point as some kind of an absolute.
Horizontal Support and Resistance
You can also create a support line by taking a relative low and drawing a horizontal line from it and doing the same thing with a relative high to form resistance. As the chart below illustrates, not every price series offers a tidy cluster of prices that is open to being organized in this manner — see the center portion of the chart, where prices are in a downtrend. It is unclear exactly where you would put a horizontal support or resistance line.
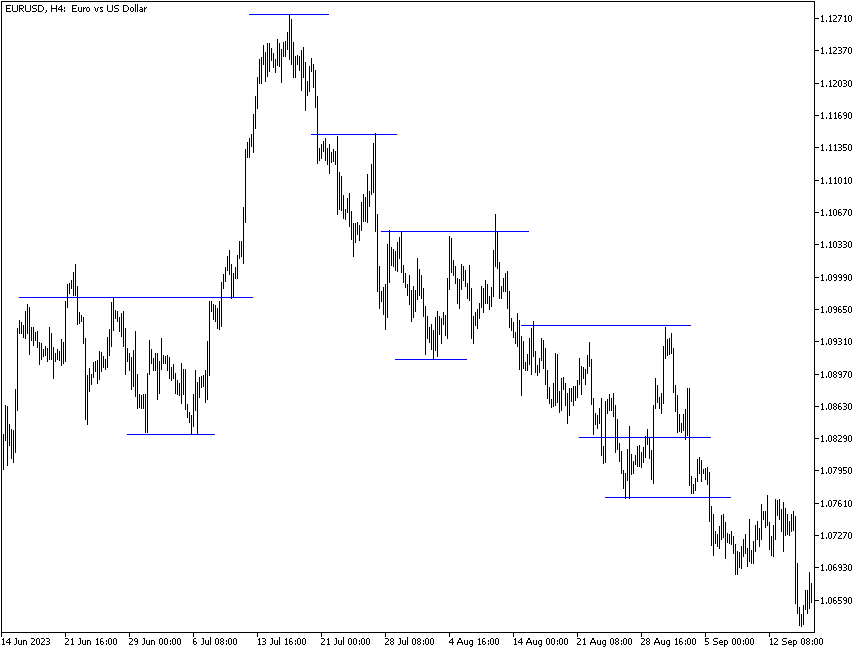
But this observation should be setting off the spark of an idea in your brain — sometimes prices are trending clearly in a single direction, as in our support example chart. A diagonally slanted line connecting lows that has a measurable slope is the appropriate line to draw. However, a horizontal support or resistance line is useful when the price series is range-trading in a relatively narrow range. Therefore, you want to use diagonal lines in a trending market and horizontal lines in a range-trading market. Since you often do not know what kind of market you are in, you need to draw both types and see what works.
Forex prices are not always trending. Periods of trendedness are punctuated by range-bound sideways price moves.
Pro tip: When you are trading in a short timeframe, such as 15-minute or one-hour bars, horizontal support and resistance lines can be especially useful.