Trading Pullbacks
What is a pullback?
Pullbacks are the counter-trend moves that punctuate every trend. Pullbacks are also named "corrections" and "retracements." No price move goes in a straight line; pullbacks are natural and normal. Usually, they are attributed to either profit-taking or second thoughts, although other reasons can be imagined for a trend to retreat a little before resuming, including the time of day, day of the week, day of the month or quarter, and plain old-fashioned randomness. Because a pullback is a retreat from trendedness, it can be identified when a momentum-based indicator falters. Some analysts believe they see "harmonic patterns" or other regularities in pullbacks, such as pullbacks always tending to end at a "measured move" or a Fibonacci number. It is up to each trader to decide if that is true and useful.
Pullbacks are the bane of every trader's existence because you have to decide whether to:
- Sit it out and wait for the trend to resume, racking up paper losses.
- Exit quickly and re-enter once the trend has resumed.
- "Fade the trend" — i.e., trade counter-trend until the pullback is over.
All three trading decisions are equally valid, and which one you choose depends on the timeframe you have selected and the confidence you have in your ability to trade in sync with market sentiment.
How to trade pullbacks
To sit out a pullback because you are convinced the trend will resume is a practice of long-term traders, who almost always have fundamentals to back up the decision. The main drawback is that you are giving up gains already made (on paper), which can be psychologically hard to do and can, of course, prove to be wrong if the pullback turns into a reversal.
Re-entering after a pullback is a standard "swing trader" technique and almost certainly the most consistently profitable method to trade pullbacks. Pullbacks do not always follow the same pattern of one dip down, a lesser rise, and a final dip down, the so-called A-B-C pattern, but whatever the pullback configuration, the point is that you want to identify when it is over. The swing technique is characterized as "buy the dips, sell the rallies." In swing trading, you never trade against the trend.
A special application of the swing method is to buy on a pullback low, buy more on a breakout in the trend direction, and wait for the pullback after the breakout to buy a third time — this is scaling in based on pullback patterns.
Most Forex traders are less committed to trading only the trend than one might think, considering that many traders chose Forex in the first place because of its superior trendedness. Instead of sitting out a pullback or aiming for the next directional swing, they fade the trend. The implication is that whatever the move, either up or down, it is likely to last long enough for a trade or two. This places breakouts at the top of the short-term trader's toolkit, although we know that breakouts are often false and sometimes just random. Because of false and random breakouts, trading breakouts alone without regard for the primary trend tends not to be a profitable strategy.
In evaluating pullbacks, you need to identify two conditions — when a pullback is going to start and when you are sure it has ended — or transformed into a reversal. To identify the start of a pullback, most traders consult a momentum indicator, and here, the stochastic oscillator is the most popular one. Unfortunately, the stochastic can point to overbought/oversold for a long time without the pullback materializing.
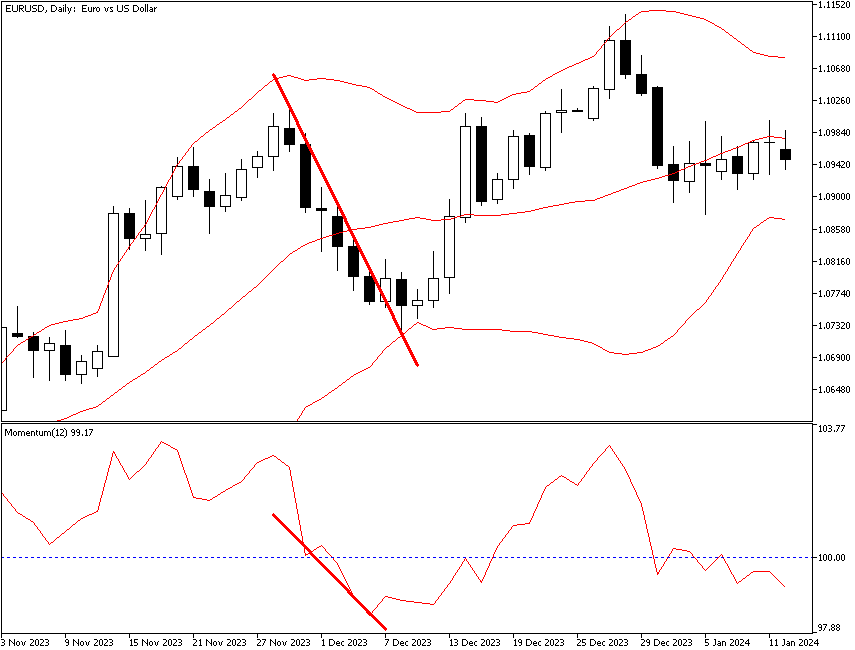
The daily chart below shows a pullback in an uptrend in EUR/USD. Momentum in the bottom window is falling as the price falls, and notice that the Bollinger Bands contracted after the pullback had concluded. Remember that in Forex, a breakout of the Bollinger Band usually does not last more than three periods before the price is roped back inside. While this particular pullback was short and went straight down before concluding, pullbacks often do not go in a straight line and can show some short periods of consolidation. The implication is that you would not want to jump the gun and consider that because the price is no longer falling, it will now start to rise when the pullback has not, in fact, ended.
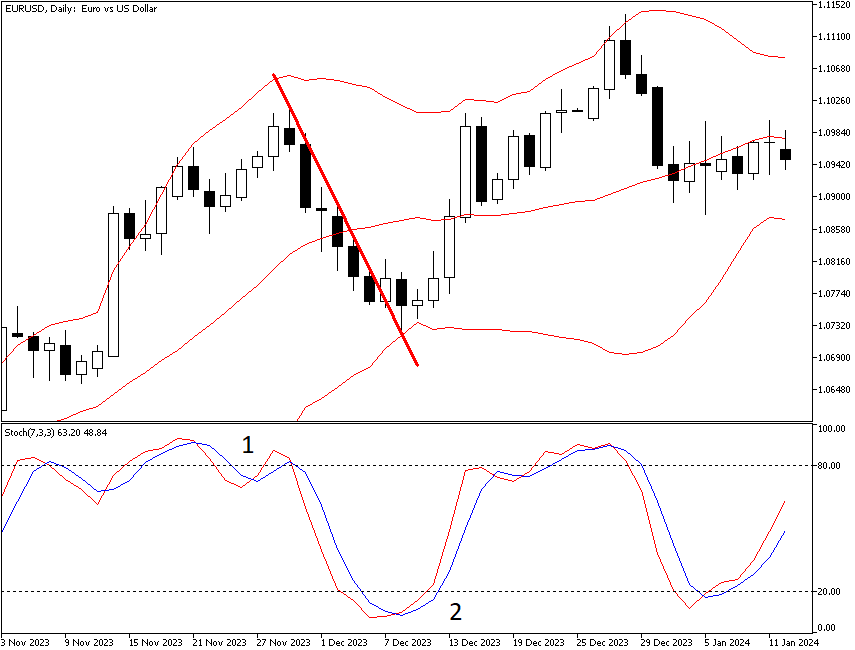
How can you anticipate when a pullback is about to hit? A top indicator is high momentum that then fizzles out — in other words, the price is overbought/oversold. See the next chart showing the Stochastic oscillator. For shorter-term trading, the Stochastic oscillator is a good tool to identify when a pullback is pending.
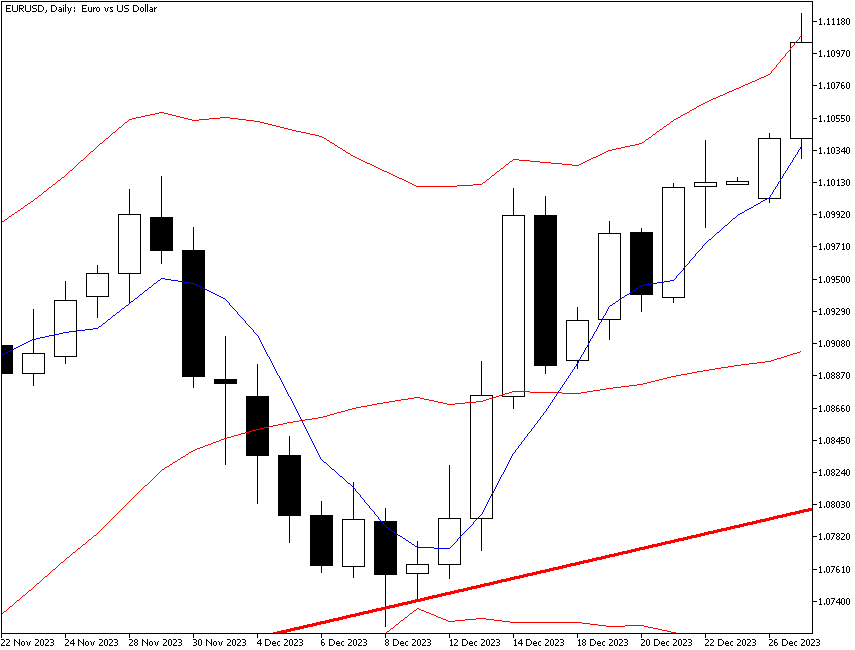
To refine your understanding of the pullback as it develops, two classic techniques are breaking a key moving average and breaking support or resistance. See the next chart. Here, the blue exponential moving average is 5 periods (while the Bollinger Bands always use 20 periods). As with all moving averages, it lags, but not fatally in this case. And when the price closes above the 5-period MA, you have a signal that the pullback is ending. The price crossing the 5-period MA to the upside coincides with the Bollinger Bands contracting. In addition, we have a new support line that the price just touches but does not break.
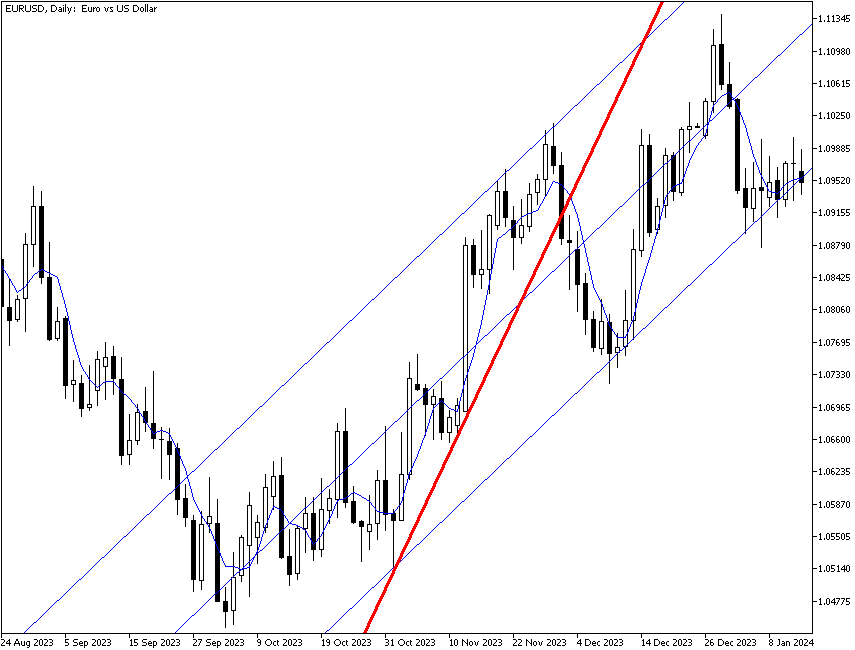
Breaking a support line is a key indicator that a pullback is no longer just a pullback and has become a reversal. This is one of the times when using multiple timeframe charts can come in handy in your pullback trading strategy. You only know that the support line is there because you have drawn it on a wider timeframe chart, like the daily if you are looking mainly at a 4-hour chart. And yet a support line can get broken without the trend being broken:
Pullbacks are the bane of every trader's existence. Judging the strength and lasting power of a pullback is an endless quest. The good idea is to find an indicator that reliably identifies pullbacks in your currency pair and your timeframe, whether RSI, Stochastic, or some other method. Here are some swing trader concepts of how to take advantage of pullbacks in Forex trading:
- Buy the first pullback after a big and meaningful breakout, with meaningful referring to a break of support/resistance, a break of the 200-day moving average, a giant gap, or a key level established in the past, including especially a round number.
- Buy the first pullback to a meaningful moving average, with meaningful referring to a moving average that reliably serves as support in your security and your trading timeframe. Leave various moving averages on your charts so that they remain there when you switch timeframes. For example, the 200-period moving average in the H4 timeframe has, weirdly, some driving power in the EUR/USD. The price accelerates (in both directions) after a breakout of that line. Some Forex analysts also like the 200-hour moving average.
- Pay attention to patterns like double tops and double bottoms, as well as certain candlestick patterns like "hanging man."