Classic and Math-Based Trend Lines
The classic definition of a trend line is the hand-drawn support or resistance line. Rules for applying trend lines were set down by Edwards and Magee in the 1948 book Technical Analysis of Stock Trends. Classic trend lines are subjective and depend on the skill of the chartist. Most analysts will not allow any breaking of the lines, while others point out that the occasional abnormal spike can safely be ignored. As a general rule, hand-drawn trend lines need to be drawn and re-drawn repeatedly, which makes them labor-intensive.
However, there is another kind of trend line that is increasingly in use in recent years — the linear regression. The linear regression has two tremendous advantages over hand-drawn lines:
- It is scientific and not subjective.
- Software draws it for you, so revision is quick and painless.
Defining the Linear Regression Trend Line
Like standard deviation, you do not need to know how to calculate a linear regression since we have the magic of software to do the calculation for us. If you have an intuitive grasp of the calculation methodology, you can use linregs.
A linear regression is a line that minimizes the distance between itself and every data point in the selected area of the chart. The figure below shows a blue linear regression line and also a red hand-drawn support line. As defined in the previous lesson, the red support line connects a series of lows and, therefore, is a border of the maximum down move we expect. The blue linear regression line, on the other hand, plows through the center of as many bars as it can.
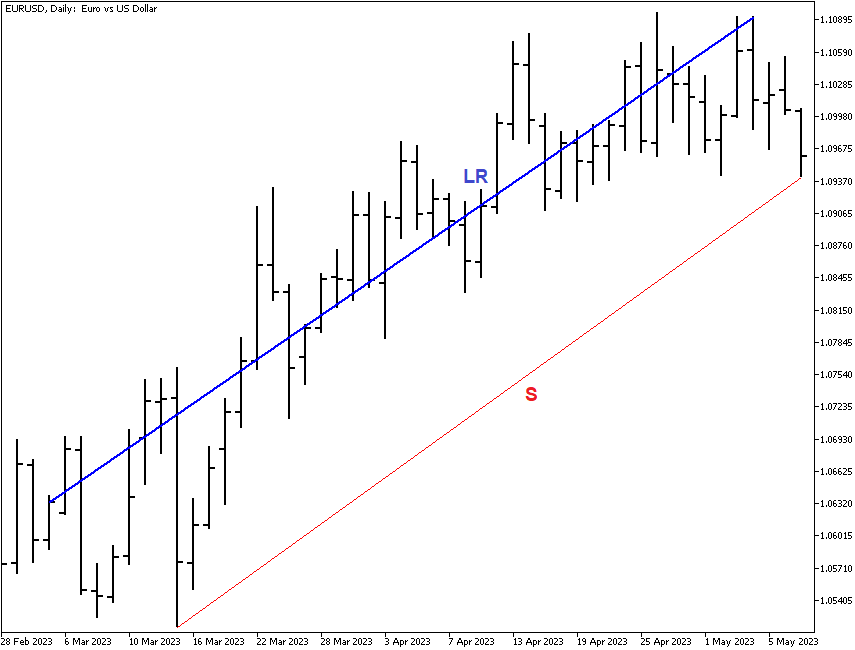
What is the right way to draw a linear regression line? There are no hard rules, but logically, you want to start the line at an obvious low and end it at an obvious high. You can also extend the linreg artificially by hand to show where the price series “should” go if the same degree of trendedness were to continue.
Did you know? When you get a hand-drawn line that is parallel or congruent with a linear regression line, you have confirmation that your hand-drawn line accurately represents the trend.
Practical Application of the Linreg
In Forex, we assume a certain degree of “central tendency,” although this can cause fistfights. The central tendency concept comes from scientific observation in the physical world (whereas in trading Forex, we are in the world of trader psychology). The basic idea of central tendency is that extreme outliers away from the trend will be corrected back toward the center, whether a moving average or some other measure – in this case, the linear regression. Therefore, if you extend the linreg line from your ending point — at the recent highest high, for example, you are establishing a hypothetical “center” around which you expect prices to oscillate if you expect the current degree of trendedness to persist.
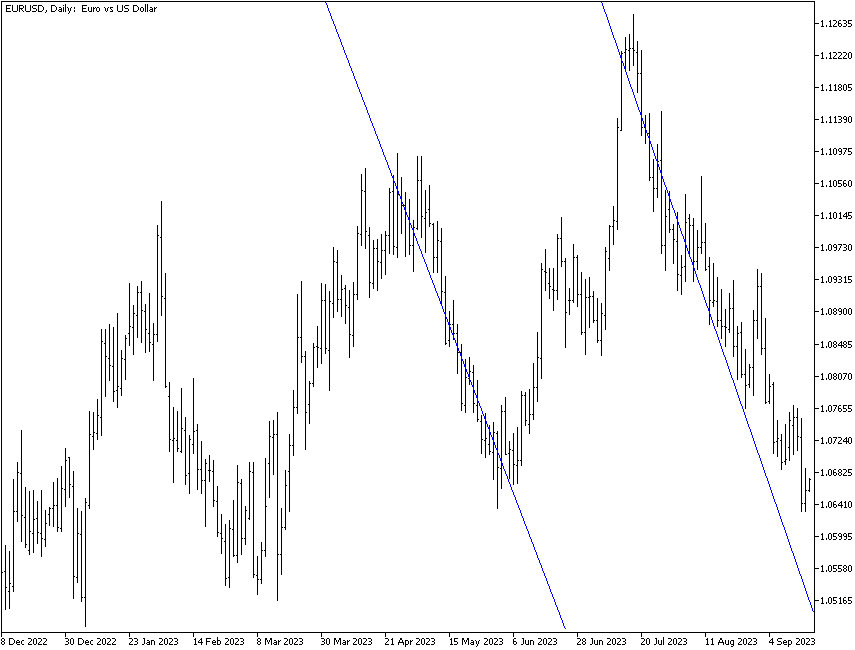
How practical is this exercise? Some currencies exhibit a habit of a certain degree of trendedness that re-asserts itself time after time. The chart below shows a linreg line drawn from a high to a low in the past and copied over exactly to the current move. The probability is not zero that we should expect this currency pair (the EUR/USD) to match the past performance in duration and extent.
Having said that, the linreg is not used much in trading Forex as an indicator. Traders do not build trading rules to guide buy/sell decisions off the linreg. We do use the linreg as the basis for other indicators (see the next lesson, on Channels, for more info on this).
Guidelines for Judging Trendlines
In classic support and resistance lines, the more near hits, the better. If near-hits are close together at the beginning of a support or resistance line, you cannot have confidence that a much later price will “obey” the line. Similarly, if the near-hits are too far apart, you do not know whether your line is valid. “Too close” and “too far” is a subjective judgment based on your timeframe, the regularity and variability of your currency, and personal preference. For example, a near-hit of a support line after three periods but then no test of support for another 30 periods probably means you drew the line wrong and should start over. This is not to say that near-hits of a trendline should be regularly spaced x periods apart, although that might be convenient. It is to reinforce the idea that support and resistance lines are subjective and you need to be watchful of errors.
Did You Know?
Most charts are shown in what is called an arithmetic scale. The arithmetic scale keeps a fixed distance between price points so that each incremental value is identical across the y-axis (such as 2, 4, 6, 8). A price move of 50 points from 1.6000 to 1.6050 (in GBP/USD) is depicted the same way as a change from 0.8000 to 0.8050 in AUD/USD. Fifty points is 50 points. This is a good way to look at charts when points gained or lost — your trading values — are alternating from background to foreground and back again as you view charts.
But another way to display charts is the semi-log scale that displays incremental values in percentage terms. In the GBP example, the change is 0.31%, while the AUD change is far bigger, 0.63%. A semi-log scale emphasizes high and low points, especially in longer-term charts containing a lot of data and when there is an extreme move. Most software will give you the option of arithmetic or semi-log scale. As a practical matter, most Forex traders have a short timeframe and expected holding period, and the use of semi-log scales does not add value.