The Trend

Magician

Master Trader
Jun 2, 2010
30
1
69
Hi, this is my 1st post, :)

At the mo at the Demo level, regarding Forex Trading,
However I have a Q, to ask
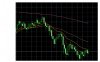
Finding the trend, I check the Mthly, Wkly, evn the Daily, I input a EMA 20, but still I have my doubts, for instance Mthly Candle is Down, Ema Down, Wkly Candle is Up but with the EMA on the downward slope, Daily is Up EMA slightly Down Sloping.
Do I go with the Candles, and that would add there own problems, or do I go with the EMA sloping Downward.
This might be a daft question, but it is doing my head in :mad:

Thanx In advance..
:)
 

Magician

Master Trader
Jun 2, 2010
30
1
69
Thanx Enivid,

I have attached a picture of an example, I have used EMA 10 (Red), 20 (Yellow), 50 (Orange), 200 (Pink),
As you see there all down-trending in order, and that the trend according to the EMA is down, yet the Mthly Candle is up.

You read Trend Is Your Friend, only if you can find it :)

Lagging EMA, but if you look at the mthly Candles in general some are upward some are downward, yet the EMA is always downward (in the attached picture)
Do I go with the mthly candle for the trend, or the ema for the trend,
am I the only one confused with this ?

Again many Thanx
 

Attachments

  • USJY.jpg
    USJY.jpg
    59.1 KB · Views: 12
Last edited:

Magician

Master Trader
Jun 2, 2010
30
1
69
From your picture it can be easily said that the candles showed downtrend 4 periods before the EMAs crossed.

Thanx for your time, it's appreciated. :)

I guess what I am asking is should I go with the general view, I.E. EMA or do I go with the Mthly Candle, I understand the EMA are lagging, but when I see the up and down of the candles and in general the trend seems to be (in this case) down, I don't know what to look at, the candles or the ema.:confused:
Good point regarding 4 periods after the fact.
It would make perfect sense to go with the mthly candle after all it's where we are at the mo, then I read that you can find the trend using the "EMA formula" and this is where (for me) it went tits up. :(

Again Thanx
 

Magician

Master Trader
Jun 2, 2010
30
1
69
Do you apply EMAs to a monthly chart? Or do you apply them to some lower timeframe chart and then check the trend on the monthly chart by one candle? If second, then it's a rather crazy thing to do.

Nope, to both, all I am trying to do is read correctly the Trend direction, and finding is all a bit confusing, if you read the candle then the trend is up, yet over-all the trend is down, do you infact just read the chart in general seeing the over all trend is down thus the trend is then down, even though the forming candle says it up.
The "in general" reading would conform to the EMA's

Envid, re-reading this has confused me :D
 

Enivid

Administrator
Staff member
Nov 30, 2008
18,606
1,366
144
Odesa
www.earnforex.com
If you use a single timeframe then it's more accurate to detect trends by watching candles than watching EMAs. Of course, the trend isn't detected by watching just one (1) candle, you have to watch the chart and look for the properties of the trend - higher highs, lower lows, etc.