Hi all,
My name is dani , I'm from Israel.
I have been trading forex for about 10 years.
I would like to introduce you to the "FOREX road map" model that specializes in identifying medium-term trading trends (days / weeks) for the major currency coins.
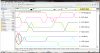
The "FOREX road map" model follows, on a daily basis, the 8 major currency coins (EUR, USD, GBP, AUD, NZD, CAD, CHF, and JPY) and ranks them according to their strength strong and weak. The model calculates "strength index" for each of the 8 currency coins and rates the result strong to weak. The index is calculated by calculating the trend power of all combinations of currency pairs of each currency coin (The EUR index for example is calculated of the trend power of the other 7 currency pairs against the EUR). The model gives a score to each of the coins when grade 0 is the weakest coin and grade 7 is the strongest coin. The trend direction trading for each currency pair determined by the ratio of the index of the currencies that make up the pair. If for example the EUR score is 6 and the USD is 2, we will look for opportunities to buy EUR and sell USD. For Example, the NZD index crossed up the JPY index & the USD index on 7 SEP 2012 (See red circle on the charts) and has since remained above them. LONG opportunities for the both pairs NZD/JPY & NZD/USD gave good results.
This model was developed by me and I use it, very successfully, for several months.
It is very important to emphasize that the "FOREX road map" is not a trading strategy. The "FOREX road map" shows, for each coin, the relative position in terms of strength / weakness, and for each currency pair the medium-term trend direction (days weeks). The correct way to use the map is to run a known trading strategy (I guess every trader has one) but only in the direction recommended by Roadmap.
My name is dani , I'm from Israel.
I have been trading forex for about 10 years.
I would like to introduce you to the "FOREX road map" model that specializes in identifying medium-term trading trends (days / weeks) for the major currency coins.
The "FOREX road map" model follows, on a daily basis, the 8 major currency coins (EUR, USD, GBP, AUD, NZD, CAD, CHF, and JPY) and ranks them according to their strength strong and weak. The model calculates "strength index" for each of the 8 currency coins and rates the result strong to weak. The index is calculated by calculating the trend power of all combinations of currency pairs of each currency coin (The EUR index for example is calculated of the trend power of the other 7 currency pairs against the EUR). The model gives a score to each of the coins when grade 0 is the weakest coin and grade 7 is the strongest coin. The trend direction trading for each currency pair determined by the ratio of the index of the currencies that make up the pair. If for example the EUR score is 6 and the USD is 2, we will look for opportunities to buy EUR and sell USD. For Example, the NZD index crossed up the JPY index & the USD index on 7 SEP 2012 (See red circle on the charts) and has since remained above them. LONG opportunities for the both pairs NZD/JPY & NZD/USD gave good results.
This model was developed by me and I use it, very successfully, for several months.
It is very important to emphasize that the "FOREX road map" is not a trading strategy. The "FOREX road map" shows, for each coin, the relative position in terms of strength / weakness, and for each currency pair the medium-term trend direction (days weeks). The correct way to use the map is to run a known trading strategy (I guess every trader has one) but only in the direction recommended by Roadmap.