Recommendation for Copper:Sell
Sell Stop: Below 4,14
Stop Loss: Above 4,64
RSI: Neutral
MACD: Sell
MA(200): Neutral
Fractals: Sell
Parabolic SAR: Sell
Bollinger Bands: Neutral
Chart Analysis

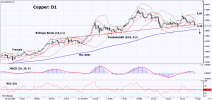
On the daily timeframe, Copper: D1 broke down the uptrend support line. A number of technical analysis indicators have generated signals for further decline. We do not exclude a bearish movement if Copper: D1 falls below the last 2 lower fractals and the lower Bollinger band: 4.14. This level can be used as an entry point. The initial risk limitation is possible above the upper Bollinger line, the last 3 upper fractals and the Parabolic signal: 4.64. After opening a pending order, move the stop to the next fractal maximum following the Bollinger and Parabolic signals. Thus, we change the potential profit / loss ratio in our favor. The most cautious traders, after making a deal, can go to the four-hour chart and set a stop-loss, moving it in the direction of movement. If the price overcomes the stop level (4.64) without activating the order (4.14), it is recommended to delete the order: there are internal changes in the market that were not taken into account.
Fundamental Analysis
Copper imports to China declined in the 1st half of 2021. Will the decline of Copper quotes continue?
In January - July 2021, China reduced imports of copper (refined copper) and copper scrap by 10.6% compared to the same period in 2020 - to 3.2 million tons. An additional negative for the quotes may be the sale of part of the state reserves of non-ferrous metals (copper, aluminum, zinc). In July 2021, the PRC authorities sold 50 thousand tons of copper from state reserves to Chinese companies in order to limit dependence on imports and reduce prices. Recall that China consumes about half of the world's copper, followed by the United States. Macroeconomic data indicating a slowdown in economic growth may have a negative impact on quotes.
Sell Stop: Below 4,14
Stop Loss: Above 4,64
RSI: Neutral
MACD: Sell
MA(200): Neutral
Fractals: Sell
Parabolic SAR: Sell
Bollinger Bands: Neutral
Chart Analysis

On the daily timeframe, Copper: D1 broke down the uptrend support line. A number of technical analysis indicators have generated signals for further decline. We do not exclude a bearish movement if Copper: D1 falls below the last 2 lower fractals and the lower Bollinger band: 4.14. This level can be used as an entry point. The initial risk limitation is possible above the upper Bollinger line, the last 3 upper fractals and the Parabolic signal: 4.64. After opening a pending order, move the stop to the next fractal maximum following the Bollinger and Parabolic signals. Thus, we change the potential profit / loss ratio in our favor. The most cautious traders, after making a deal, can go to the four-hour chart and set a stop-loss, moving it in the direction of movement. If the price overcomes the stop level (4.64) without activating the order (4.14), it is recommended to delete the order: there are internal changes in the market that were not taken into account.
Fundamental Analysis
Copper imports to China declined in the 1st half of 2021. Will the decline of Copper quotes continue?
In January - July 2021, China reduced imports of copper (refined copper) and copper scrap by 10.6% compared to the same period in 2020 - to 3.2 million tons. An additional negative for the quotes may be the sale of part of the state reserves of non-ferrous metals (copper, aluminum, zinc). In July 2021, the PRC authorities sold 50 thousand tons of copper from state reserves to Chinese companies in order to limit dependence on imports and reduce prices. Recall that China consumes about half of the world's copper, followed by the United States. Macroeconomic data indicating a slowdown in economic growth may have a negative impact on quotes.

