Last month, the EURO JPY and CHF JPY pairs broke their respective Consolidation Setups on their Daily Charts to start downtrends in favour of the Japanese Yen. This was expected to provide several hundreds of Pips in gains for traders over several weeks given the size of the Consolidations that were broken. However, although the CHF JPY did move by over 200 Pips (providing us with a 101-Pip gain), the EURO JPY only provided us with just under 50 Pips in profits before pulling back.
Nevertheless, despite the combined profitability of these trades being lower than expected, the sharp 400-Pip reversals that took place highlighted the accuracy of the Holding Periods used for these Swing Trading Strategies.
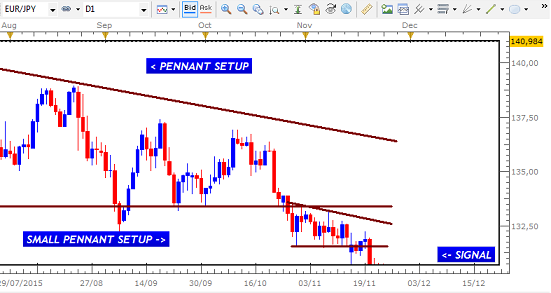
EURO JPY TRADE
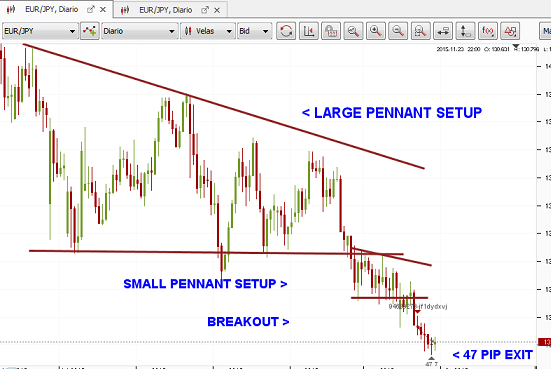
A target of 172 Pips was initially set to be captured from the Pennant breakout below its Support boundary. However, due partly to the lack of market activity during the Thanksgiving holiday period, the trade was only up by 47 Pips at the end of the Holding Period - smaller than expected but a win nevertheless.
DAILY CHART
 (FXCM Charts used for Entry Signals as they use the New York Close of the Daily Candle - crucial for the Price Action Methodology)
DAILY CHART

(Actual Trades done using the Dukascopy Platform)
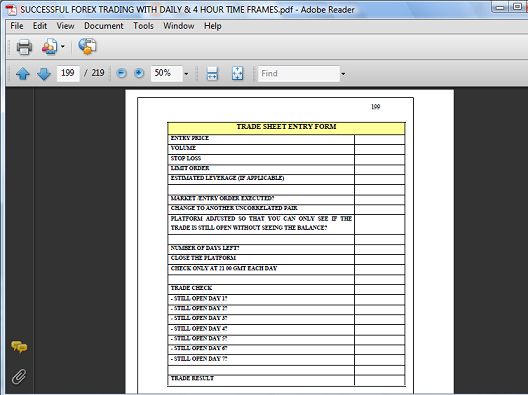
The decision to exit this trade was controlled by the Holding Period Rule for this breakout strategy. As you can see from the Trade Sheet, a maximum of 7 Days is used for these trades and once this limit has been reached, the trade is closed - regardless of the floating profit or what we would have wanted from the trade.
TRADE SHEET

("Successful Forex Trading With the Daily and 4 Hour Time Frames".
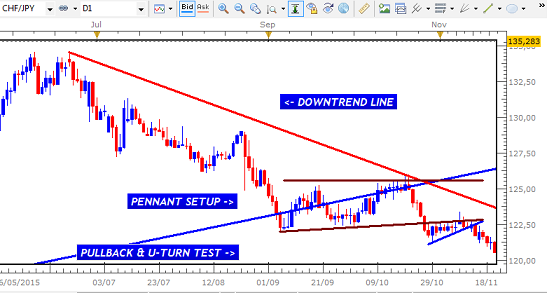
CHF JPY TRADE
This was a similar trade that took place during the same period as the EURO JPY breakout. A Pennant Setup was also being broken at Support following a pullback that tested then U-Turned at this boundary. The nature of the candles that started the breakout indicated that we would be using the Swing Trading Strategy for Slow Breakouts.
DAILY CHART


Having determined that the setup and signals conformed to the criteria for this strategy, the trade was executed with an initial target of 180 Pips. However, at the end of the Holding Period for this strategy, the trade was up by 101 Pips - again, smaller than planned but a good trading gain nevertheless.
DAILY CHART

SHARP REVERSALS
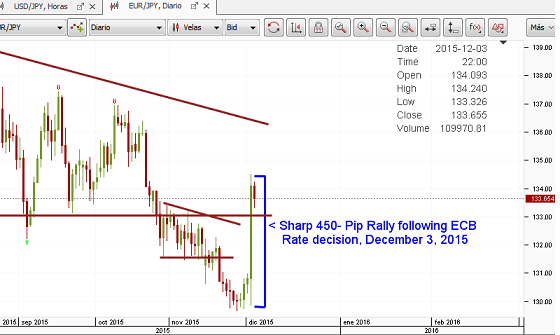
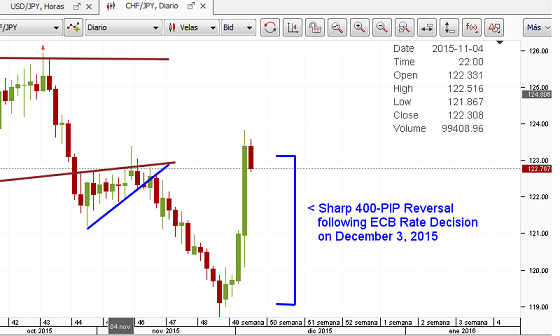
The decisions to close these trades at the end of their respective Holding Periods were proven to be spot on given the reversals that took place a few days later. These reversals reflected the market reaction to the decisions made by the European Central Bank on Thursday December 4, 2015.
EURO JPY

CHF JPY

The reversals on both now indicate that we are starting the patterns of False Breakouts that will take us quickly back inside of these Consolidations. Following this, it is likely that they will breakout at Resistance to start strong Uptrends in favour of the EURO and the CHF.
These sharp movements reinforced the need for Swing Traders to always implement and obey the time limits set for our trades. Reversals of 10, 20 or even 40 Pips are usually the consequences of disobeying these rules, but pullbacks of 400 Pips have a way of sobering us up to the harsh reality of what this market can do to us when we trade based on emotions, greed and our ego. It is often very tempting to want more out of a trade especially after a loss or when the market has only given us a fraction of what we want out of a trade. However, it always better to have smaller gains than large losses.