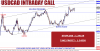
USDCAD index indicating bearish signals you will see 1.28822-1.28650-1.28597 levels soon.
USDCAD follow (05/08/2016 high 1.31984 level and 18/08/2016 low 1.27622 level).
If USDCAD close above 1.29287 level you may see upto 1.29643 level.


yes this is knoweldgeble[URL deleted]
USDJPY index daily chart is indicating downtrend. You will see 103.376 – 102.666 – 102.326 levels soon.
104.599 level is resistance level for free subscribers.
Is USDJPY INDEX changing trend?
Where resistance become support ?
Keep in touch...
[URL deleted]
USDCNY index hourly chart is creating selling pressure, you will see 6.6946 – 6.6926 – 6.6887 levels soon!
Keep in mind USDCNY index close above 6.6971 level, it’ll fly upto 6.7003 level.