i-IntradayFibonacci is a powerful VertexFX client side VTL indicator that displays the valid Fibonacci levels for the current day based on the previous day.
Fibonacci levels form important decision points for trading, as well as support and resistance levels.
A Fibonacci retracement is a popular tool among technical traders and is based on the key numbers identified by mathematician Leonardo Fibonacci in the 13th century.
In technical analysis, a Fibonacci retracement is created by taking two extreme points (usually a major peak and trough) on a stock chart and dividing the vertical distance by the key Fibonacci ratios of 23.6%, 38.2%, 50%, 61.8% and 100%. Once these levels are identified, horizontal lines are drawn and used to identify possible support and resistance levels.
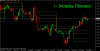
This indicator displays the 23.6%, 38.2%, 61.8% and the 76.4% Fibonacci levels based on the previous days range. The previous day's range (previous High minus previous Low) is calculated, and the various levels are added to the previous day's Low.
CYAN - 23.6% level from previous day's Low.
GREEN - 38.2% level from previous day's Low.
YELLOW - 61.2% level from previous day's Low.
BROWN - 76.4% from previous day's Low.
Ideally, when the price falls rises above the BROWN (76.4%) level a bullish breakout is expected and similarly, when the price falls below the CYAN (23.6%) level, a bearish breakout is expected.
This indicator can be used in conjunction with other indicators to confirm the direction of the trade.
NOTE - This indicator is applicable on H4 and lower chart time-frames. This indicator does not provide BUY or SELL signals.
Fibonacci levels form important decision points for trading, as well as support and resistance levels.
A Fibonacci retracement is a popular tool among technical traders and is based on the key numbers identified by mathematician Leonardo Fibonacci in the 13th century.
In technical analysis, a Fibonacci retracement is created by taking two extreme points (usually a major peak and trough) on a stock chart and dividing the vertical distance by the key Fibonacci ratios of 23.6%, 38.2%, 50%, 61.8% and 100%. Once these levels are identified, horizontal lines are drawn and used to identify possible support and resistance levels.
This indicator displays the 23.6%, 38.2%, 61.8% and the 76.4% Fibonacci levels based on the previous days range. The previous day's range (previous High minus previous Low) is calculated, and the various levels are added to the previous day's Low.
CYAN - 23.6% level from previous day's Low.
GREEN - 38.2% level from previous day's Low.
YELLOW - 61.2% level from previous day's Low.
BROWN - 76.4% from previous day's Low.
Ideally, when the price falls rises above the BROWN (76.4%) level a bullish breakout is expected and similarly, when the price falls below the CYAN (23.6%) level, a bearish breakout is expected.
This indicator can be used in conjunction with other indicators to confirm the direction of the trade.
NOTE - This indicator is applicable on H4 and lower chart time-frames. This indicator does not provide BUY or SELL signals.