Monthly : On the monthly chart. The GBP/USD is below a major resistance level. From the previous bearish move, the market has retraced up to 38.2%, so we expect a move to the downside.
DAILY : The big wick on both side of Yesterday’s candlestick is characteristic of a DOJI pattern. This means that the market shows some rejection around this resistance level at 1.3209. It might be time to look for a short Opportunity.
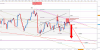
H4: Price are inside a downtrend. THE GBP USD has just completed a wave 1 and 2, and now it seems that the market has built a sub-wave 2. However, the SMA(50) is bearish so if you short the Pound Dollar it makes the most sense to target intermediate TP, and to protect your position before prices reach the SMA(50).
DAILY : The big wick on both side of Yesterday’s candlestick is characteristic of a DOJI pattern. This means that the market shows some rejection around this resistance level at 1.3209. It might be time to look for a short Opportunity.
H4: Price are inside a downtrend. THE GBP USD has just completed a wave 1 and 2, and now it seems that the market has built a sub-wave 2. However, the SMA(50) is bearish so if you short the Pound Dollar it makes the most sense to target intermediate TP, and to protect your position before prices reach the SMA(50).