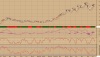
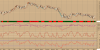
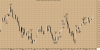
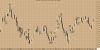
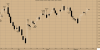
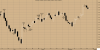
USD/JPY DAILY as of Wednesday, 17 July, 2013
*** Intra-Daily Trading Strategy: BUY US Dollar / Japanese Yen
Buy Target: 99.6213
Buy Stop: 98.8957
Enter New BUY on OPEN and exit BUY positions at Target price or at Stop price.
(NOTE: Adjust Stop Loss Price according to your trading risk.)
Do not reverse after exiting. This is a recommendation for INTRA-DAY TRADING only!!!!!
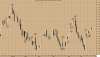
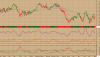
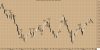
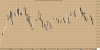
A white body has formed as prices closed higher than open.
The previous 10 candlestick bars, there are 6 white candles versus 4 black candles with a net of 2 white candles.
The previous 50 candlestick bars, there are 30 white candles versus 20 black candles with a net of 10 white candles.
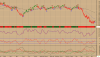
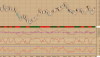
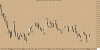
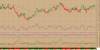
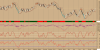
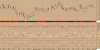
MACD is BEARISH as the MACD is below the signal line.
The MACD crossed below the signal line today. Since the MACD crossed the MACD moving average, US Dollar / Japanese Yen's price has been unchanged, and has been fluctuating from a high of 99.538 to a low of 99.082.
The ADX is currently below both Plus and Minus Directional indicators and the Directional Movement Indicators (DMI) currently is not indicating a specific price direction. Should not use to initiate any trades right now.
SAR signal was a Sell 5 period(s) ago.
The close is currently
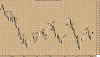
ABOVE its 200 daily moving average
ABOVE its 50 daily moving average
ABOVE its 20 daily moving average
The current market condition for US Dollar / Japanese Yen is Very Bullish
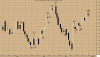
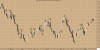
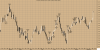
The most recently confirmed down trendline for US Dollar / Japanese Yen has an ending point currently at 100.93. Expect prices to have some difficulty rising above this trendline. A break above this trendline would be a bullish sign.
US Dollar / Japanese Yen closed below the upper Bollinger Band by 46.3%. Bollinger Bands are 9.13% narrower than normal. The current width of the Bollinger Bands (alone) does not suggest anything conclusive about the future volatility or movement of prices.
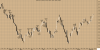
An Inside Day Narrow Range was detected by Elliott Waves High Volatility on 17/07/2013. This is usually a trade set-up opportunity
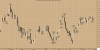
Elliott Waves High Volatility has detected an Isolated Low at 98.90 one bar ago ; this is usually a bullish sign
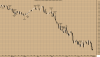
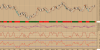
The present wave patterns are:
fast amplitude (8%): bullish wave 5
moderate amplitude (13%): bullish wave 1
normal amplitude (21%): bullish wave 1
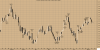
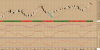
US Dollar / Japanese Yen is long term Bullish as the 144 days moving average of 95.22 is increasing. The Relative Strength Index is at 51.20 in the neutral territory. The Relative Momentum Index is at 52.10 in the neutral territory. An important indicator for Elliott waves, the Elliott oscillator is at 0.45, in positive territory; this is a bullish sign. An equally important indicator, the STORSI is at 24.02. This value is in the oversold territory.
*** Intra-Daily Trading Strategy: BUY US Dollar / Japanese Yen
Buy Target: 99.6213
Buy Stop: 98.8957
Enter New BUY on OPEN and exit BUY positions at Target price or at Stop price.
(NOTE: Adjust Stop Loss Price according to your trading risk.)
Do not reverse after exiting. This is a recommendation for INTRA-DAY TRADING only!!!!!
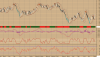
A white body has formed as prices closed higher than open.
The previous 10 candlestick bars, there are 6 white candles versus 4 black candles with a net of 2 white candles.
The previous 50 candlestick bars, there are 30 white candles versus 20 black candles with a net of 10 white candles.
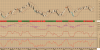
MACD is BEARISH as the MACD is below the signal line.
The MACD crossed below the signal line today. Since the MACD crossed the MACD moving average, US Dollar / Japanese Yen's price has been unchanged, and has been fluctuating from a high of 99.538 to a low of 99.082.
The ADX is currently below both Plus and Minus Directional indicators and the Directional Movement Indicators (DMI) currently is not indicating a specific price direction. Should not use to initiate any trades right now.
SAR signal was a Sell 5 period(s) ago.
The close is currently
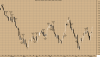
ABOVE its 200 daily moving average
ABOVE its 50 daily moving average
ABOVE its 20 daily moving average
The current market condition for US Dollar / Japanese Yen is Very Bullish
The most recently confirmed down trendline for US Dollar / Japanese Yen has an ending point currently at 100.93. Expect prices to have some difficulty rising above this trendline. A break above this trendline would be a bullish sign.
US Dollar / Japanese Yen closed below the upper Bollinger Band by 46.3%. Bollinger Bands are 9.13% narrower than normal. The current width of the Bollinger Bands (alone) does not suggest anything conclusive about the future volatility or movement of prices.
Please note that all wave counts are based on the high low price in this commentary!
An Inside Day Narrow Range was detected by Elliott Waves High Volatility on 17/07/2013. This is usually a trade set-up opportunity
Elliott Waves High Volatility has detected an Isolated Low at 98.90 one bar ago ; this is usually a bullish sign
The present wave patterns are:
fast amplitude (8%): bullish wave 5
moderate amplitude (13%): bullish wave 1
normal amplitude (21%): bullish wave 1
US Dollar / Japanese Yen is long term Bullish as the 144 days moving average of 95.22 is increasing. The Relative Strength Index is at 51.20 in the neutral territory. The Relative Momentum Index is at 52.10 in the neutral territory. An important indicator for Elliott waves, the Elliott oscillator is at 0.45, in positive territory; this is a bullish sign. An equally important indicator, the STORSI is at 24.02. This value is in the oversold territory.