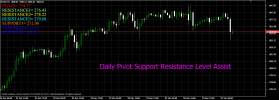
Daily Pivot, Support and Resistance Levels Assist indicator is a VertexFX VTL indicator that provides Daily Pivot Points, Supports and Resistance levels values on the charts. These Values mainly include values for Pivot Point, Resistance1, Resistance2, Resistance3, and the corresponding Support level Support 1, Support2, Support3 in one of the Corners on the chart.
This indicator is very useful to determine daily limits of trading, and the levels at which the market will enter into resistance and support zones. It provides three support levels (S1, S2 and S3) and three resistance levels (R1, R2 and R3) along with the daily pivot level.
The calculations for P, R1, S1, R2, S2, R3 and S3 are as follows :
P = ( High + Low + Close) / 3
R1 = 2 x P - Low
S1 = 2 x P - High
R2 = P + (High - Low)
S2 = P - (High - Low)
R3 = 2 x P + (High - 2 x Low)
S3 = 2 x P - (2 x High - Low)
If the market is trading above the Pivot point value, the market's sentiment is bullish and may find resistance levels. If the market is trading below the Pivot point value, the market's sentiment is bearish and may go down to Support levels.
The daily prices tend to stay within the S3 and R3 band. So, reversal strategies can be employed between S3 and R3. The trade can expect the direction to reverse at support and resistance levels. When the price touches the support level, it will bounce above, and when the price reaches the resistance level it falls back.
Breakout strategies can be employed beyond S3 and R3. When the price breaks above R3 or below S3 decisively with volume, stop losses should be engaged, and the trade should consider trading in the direction of the breakout.
https://www.hybridsolutions.com/plu...ot-resistance-and-support-levels-assist-.html

