what does it mean when after a 70% rally and a long period of accumulation the price opens above the bollinger band as in this case?
Here I am talking about Chainlink
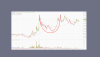
The coin peaked last year making an x20 and reaching $ 4.50. Then there was a long 6 month accumulation period with cup and handle
clear
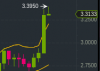
Now it's over $ 3 again and we have this candle doing this on the daily chart
What does it mean? A dump persists or the fact that the candle remains above the bollinger bands is bullish and the coin will go towards its previous All time high?
Here I am talking about Chainlink
The coin peaked last year making an x20 and reaching $ 4.50. Then there was a long 6 month accumulation period with cup and handle
clear
Now it's over $ 3 again and we have this candle doing this on the daily chart
What does it mean? A dump persists or the fact that the candle remains above the bollinger bands is bullish and the coin will go towards its previous All time high?