The Holy Grail is... well, just beyond the next rainbow, or so I may think.
This system is another variation of the trend follower. It takes information from the daily chart and trades on the h1 chart.
The system was coded using ACM ProBacktest. Here is the breakdown of the program.
//triggers
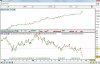
Under this section the program checks to see if a 7 period simple moving average is greater than a 50 period simple moving average on the daily chart.
// filters
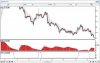
Under this section we have the Range Action Verification Index (RAVI), Channel Ten, and the Guide.
The RAVI does a similar job as the ADX by checking the daily chart to see if there is a trend.
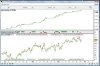
Channel Ten sets up three 10 period exponential moving averages on the h1 chart as shown in the ''indicator.jpg'' attachment. Only two are used in the program.
The Guide is a 3 period exponential moving average; If the Guide is below the 10 period exponential moving average of the low of the bar, then the Guide and Channel Ten are in sell mode. If the Guide is above the 10 period exponential moving average of the high of the bar, then the Guide and Channel Ten are in buy mode.
//short
Under this section the program will check the value of the RAVI, and match it to a defined setting, here 0.7 is used The program will then check the status of Channel Ten for sell mode .
//long
Just the opposite of the function under "//short" with the RAVI again set to match 0.7.
The program will go long on market if both the conditions under "//long" and "//trigger" are in buy mode. The program will sell if the 7 period simple moving average becomes less than the 50 period moving average on the daily chart.
Again the opposite will happen for shorting the market and exiting the short.
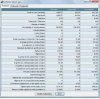
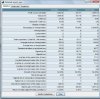
Please see the attached files and tell me if the Holy Grail is just beyond the next rainbow or if the detailed reports are just another one of the effects of the random walk theory. Tests were done with stops at 100PIPS.
Robermal
This system is another variation of the trend follower. It takes information from the daily chart and trades on the h1 chart.
The system was coded using ACM ProBacktest. Here is the breakdown of the program.
//triggers
Under this section the program checks to see if a 7 period simple moving average is greater than a 50 period simple moving average on the daily chart.
// filters
Under this section we have the Range Action Verification Index (RAVI), Channel Ten, and the Guide.
The RAVI does a similar job as the ADX by checking the daily chart to see if there is a trend.
Channel Ten sets up three 10 period exponential moving averages on the h1 chart as shown in the ''indicator.jpg'' attachment. Only two are used in the program.
The Guide is a 3 period exponential moving average; If the Guide is below the 10 period exponential moving average of the low of the bar, then the Guide and Channel Ten are in sell mode. If the Guide is above the 10 period exponential moving average of the high of the bar, then the Guide and Channel Ten are in buy mode.
//short
Under this section the program will check the value of the RAVI, and match it to a defined setting, here 0.7 is used The program will then check the status of Channel Ten for sell mode .
//long
Just the opposite of the function under "//short" with the RAVI again set to match 0.7.
The program will go long on market if both the conditions under "//long" and "//trigger" are in buy mode. The program will sell if the 7 period simple moving average becomes less than the 50 period moving average on the daily chart.
Again the opposite will happen for shorting the market and exiting the short.
Please see the attached files and tell me if the Holy Grail is just beyond the next rainbow or if the detailed reports are just another one of the effects of the random walk theory. Tests were done with stops at 100PIPS.
Robermal