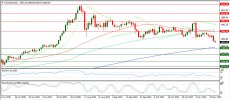
XAUUSD Daily Chart:

Following yesterday falling below last week recorded low at $1852.70, The gold extended its slide to be trading now during the Asian session below $1930 per ounce with ascending downside momentum.
XAUUSD is trading now at a deep place below its daily SMA50 and its daily SMA100, after failing try to get over them ended to forming another lower high at $1898.96 on Nov. 16.
XAUUSD is trading now in its day number 12 of consecutive being below its daily Parabolic SAR (step 0.02, maximum 0.2) which is reading today $1943, after massive drop to $1850.44 on Nov. 9.
The daily chart of XAUUSD shows that its RSI-14 is now at a lower place inside its neutral area reading 36.159.
XAUUSD daily Stochastic Oscillator (5, 3, 3) which is more sensitive to the volatility is having now its main line inside its oversold territory reading 16.598, leading to the downside its signal line which is still higher inside the neutral area reading 24.244, after negative crossover inside this neutral area.
Important levels: Daily SMA50 @ $1894, Daily SMA100 @ $1910 and Daily SMA200 @ $1796
The Closest Experienced S&R:
S1: $1789.03
S2: $1747.32
S3: $1704.00
R1: $1898.96
R2: $1965.50
R3: $2015.80
Kind Regards
Global Market Strategist of FX-Recommends
Walid Salah El Din

