Elliottwave-Forecast

Master Trader
Feb 17, 2017
2,451
9
84
www.elliottwave-forecast.com
Elliott Wave View on USDJPY suggests the rally from October 3 low is unfolding as a leading diagonal. A leading diagonal is one form of a 5 waves move with wave 1 and 4 overlapping and the structure looks like a wedge. Up from October 3 low, wave ((i)) ended at 108.93 (not shown on chart), and wave ((ii)) pullback ended at 107.87. Pair then resumed higher in wave ((iii)) and ended at 109.49. Wave ((iv)) pullback remains in progress and expected to end at 108.26 - 108.65 area.

Pair should then resume higher in wave ((v)) and it should also end wave 1 in higher degree. Afterwards, expect pair to pullback in wave 2 to correct cycle from October 3 low before the rally resumes. As far as pivot at 107.87 low stays intact in the first degree, expect pair to find support soon and resume higher. The alternative scenario suggest the rally from August 27 low ended at 109.49 as a 5 waves diagonal. In this scenario, pair should then pullback to correct the entire rally from August 27 low in larger 3 waves before the rally resumes.

USDJPY 1 Hour Elliott Wave Chart


Elliottwave-Forecast

Master Trader
Feb 17, 2017
2,451
9
84
www.elliottwave-forecast.com
The Coca-Cola Company (NYSE: KO) is an American multinational corporation and it's the world's leading soft-drink company.

Since February 2019, KO rallied higher within an impulsive 5 waves advance breaking to new all time highs and opening further extension. Down from $56 peak, the stock started a correction lower which is currently unfolding as Double Three Structure which reached the equal legs area $52 – $50 from where buyers are expected to show up to resume the rally within the main bullish trend or provide a 3 waves bounce at least.

KO Daily Chart 11.3.2019


The above blue box is a High-frequency area where the stock is likely to end the cycle because it's a zone used as a hedging area where buyers and sellers agrees on a technical reaction to take place from there allowing the stock to turn . Therefore, as long as the trend remains intact and more importantly $44 low is holding then KO will find support and bounce to the upside.

If the expected bounce fail to break to new highs, the stock can still do a 7 swings correction from September peak and find another extreme area later on at lower level before buyers would step in again for another chance to buy it.

KO Daily Chart Double Correction


In Conclusion, KO bullish cycle should remain intact as long as February low is holding and buyers are looking to remain in control because the stock is doing a corrective decline which is expected to presenting buying opportunities before resuming the move to the upside.
 

Elliottwave-Forecast

Master Trader
Feb 17, 2017
2,451
9
84
www.elliottwave-forecast.com
CADJPY Technical Analysis November 14/2019

CADJPY : A possible bullish pattern is visible on the Daily time frame. The blue bullish pattern still needs to make a push lower to complete point D at the BC 0.50% Fib. retracement level where CADJPY can possibly bounce higher from. If price extends higher above the AB 2.24% Fib. level before reaching the BC 0.50% Fib. level then the bullish pattern is invalid and BUY setup is cancelled. If looking to trade CADJPY traders should be patient and wait for price to make a move lower towards the minimum BC 0.50% Fib. retracement level. Waiting for price to hit the BC 0.50% Fib. retracement minimum will offer a better risk/reward trade setup. Traders will also need to watch if indicator and price forms a visible bullish divergence. A bullish divergence will add more confirmation that the pair can reverse and bounce higher. Blue bullish pattern is invalidated if price moves below point B of the pattern but for this BUY trade setup Stop Loss will be placed at the previous Higher Low (79.81). A break below this level stops the Higher High/Higher Low sequence and will signal for more possible downside. If price bounces higher then watch for green target levels to hit. We remain bullish for now and we expect for the pair to extend higher towards the 84.50 area.

CADJPY Daily Chart 11.14.2019


Of course, like any strategy/technique, there will be times when the strategy/technique fails so proper money/risk management should always be used on every trade.
 

Elliottwave-Forecast

Master Trader
Feb 17, 2017
2,451
9
84
www.elliottwave-forecast.com
The Nasdaq Tracker QQQ Long Term Cycles & Elliott Wave

Firstly the QQQ instrument inception date was in March 1999. That was before it ended a larger cycle up from the all time lows in March 2000. The ETF instrument mirrors the price movement of the Nasdaq which did that. As shown below from the March 2000 highs the instrument experienced a steep correction lower in three swings to the October 2002 lows. From there to the October 2007 highs it ended the first of the current series of impulses in the blue color. This makes up the subdivisions of the wave ((III)) that is in progress.

As can be seen, the pullback from the October 2007 highs was in 3 swings that ended in November 2008. This corrected the cycle up from the October 2002 lows. From there it appears the wave I was the extended oddity of the impulse subdivision of wave (III). Considering the wave three's are the usual extended Elliott wave this is a bit odd although not unheard of. The wave II low created in August 2015 was strong enough to suggest it was correcting the cycle the November 2008 lows. Equally the same thought applies to the move up from there into the August 2018 wave (III) high.

It appeared the wave IV was only deep enough to be correcting the cycle from the August 2015 low. From there it saw another high in August 2018. The wave (IV) into the December 2018 lows was strong. It suggested it had corrected the cycle from the November 2008 low. The analysis and commentary continues below the QQQ Monthly chart.


Secondly as previously suggested the QQQ instrument mirrors the Nasdaq highs & lows. In addition the cycle up from the October 2002 lows remains in progress. Assuming the before hand data, the instrument has an all time high in March 2000. From there it has an Elliott wave incomplete sequence higher. The analysis and conclusion continues below the QQQ Weekly chart.


In conclusion the move up from the December 2018 wave (IV) lows appears to be incomplete. The target area figures on the weekly chart blue box represents the equal legs of the wave I & II of the cycle up from the December 2018 lows which is 228.17 As shown the 247.14 number represents the Fibonacci extension 61.8% of the cycle up from the October 2002 lows. Afterward the instrument can see a pullback lower of the same magnitude as like in the March 2000 to October 2002 lows in wave ((IV)) before turning higher again.

Thanks for looking. Feel free to come visit our website.
 

Elliottwave-Forecast

Master Trader
Feb 17, 2017
2,451
9
84
www.elliottwave-forecast.com
In this technical blog we’re going to take a quick look at the Elliott Wave charts of NIKKEI published in the membership area of the elliottwave-forecast . As our members know, NIKKEI ended cycle from the 22427 low as 5 waves structure. We got 3 waves pull back , when the price reached Equal Legs – Blue Box. NIKKEI found buyers at that area as we expected. In further text we’re going to explain Elliott Wave Forecast.

NIKKEI 1 Hour Elliott Wave Analysis 11.14.2019
NIKKEI is correcting the cycle from the 22427 low, when Pull back is unfolding as Elliott Wave Double Three Pattern. We can count clear 7 swings down from the peak when the price has already reached the equal legs- Blue Box area. We don't have any clear sign yet that pull back is done, but we are aware that turn can happen any moment . As our members know, Blue Boxes are no enemy areas , giving us 85% chance to get a reaction from there. We expected buyers to appear at the blue box for a proposed rally or 3 waves bounce alternatively and extend lower to continue correcting cycle from 10/3 low. We advise members to avoid selling against the main bullish trend and expect rally to happen from the blue box in 3 waves bounce at least.


NIKKEI 1 Hour Elliott Wave Analysis 11.18.2019
NIKKEI found buyers right at the blue box area. We are getting nice reaction from there so far. At this stage we are calling wave (4) blue pull back completed as Flat Pattern. We would like to see further extension higher and break above 11/07 high to confirm next leg up is in progress. Otherwise break below 23013 low would open possibility for a deeper correction.

Keep in mind market is dynamic and presented view could have changed in the mean time. You can check most recent charts in the membership area of the site. Best instruments to trade are those having incomplete bullish or bearish swings sequences.


Elliottwave-Forecast

Master Trader
Feb 17, 2017
2,451
9
84
www.elliottwave-forecast.com
DAX shows an incomplete Elliott Wave sequence from December 27, 2018 low favoring further upside. The rally from August 15, 2019 low (11266.48) is unfolding as an impulse Elliott Wave structure where wave 1 ended at 12814.49 and wave 2 pullback ended at 12607.06. Wave 3 remains in progress and the internal subdivides in 5 waves of lesser degree. Up from 12607.06, wave ((i)) ended at 12986.49 and wave ((ii)) pullback ended at 12795.09. The Index has resumed higher again in wave ((iii)) towards 13308.26 and wave ((iv)) pullback is proposed complete at 13137.88. Expect Index to extend higher 1 more time to end wave ((v)) of 3, then it should pullback in wave 4 to correct cycle from October 18 low before the rally resumes again in wave 5.

Near term, while dips stay above 12607.06, expect the Index to extend higher. We don't like selling the Index and expect buyers to appear in any dip in the sequence of 3, 7, or 11 swing for more upside. Possible target higher is 100% Fibonacci extension from December 2018 low which comes at 13660 - 14221. The Index still needs to break above wave ((iii)) at 13308.26 to avoid a double correction. If the Index instead turns lower and breaks below 13137.88, then the Index is doing a double zigzag. In this case, it will still find support after it ends a 7 swing pullback

DAX 1 Hour Elliott Wave Chart
 

Elliottwave-Forecast

Master Trader
Feb 17, 2017
2,451
9
84
www.elliottwave-forecast.com
Short Term Elliott Wave view on Ten Year Notes (ZN_F) suggests that the decline to 128 ended wave w. Wave x bounce is unfolding as a zigzag Elliott Wave structure. Wave ((A)) of x remains in progress with internal subdivision of a 5 waves impulse. Up from 128, wave (1) ended at 128.18 and pullback in wave (2) ended at 128.04. The Notes then resumed higher in wave (3) which ended at 129.15. Internal subdivision of wave (3) is also in 5 waves of lesser degree. Wave (4) pullback then completed at 128.31.
Up from 128.31, we can see a clear 5 waves as internal within wave (5). Near term, the Notes has enough number of swing to end wave (5) of ((A)) and it is expected to complete wave ((A)) soon. Afterwards, expect the Notes to pullback in wave ((B)) to correct cycle from 11/8/2019 low in 3, 7, or 11 swing before the rally resumes. We don't like selling the Notes. As far as pivot at 128 low remains intact, expect buyers to appear during the dip in 10 year Notes in 3, 7, or 11 swing for another extension higher.
ZN_F 1 Hour Elliott Wave Chart
Elliott Wave View: Impulsive Rally in 10 Year Notes (ZN_F)
 

Elliottwave-Forecast

Master Trader
Feb 17, 2017
2,451
9
84
www.elliottwave-forecast.com
Exxon Mobil (ticker symbol: $XOM) shows an incomplete 5 swing Elliott Wave sequence from April 23, 2019 high favoring further downside. In the short term chart below, we can see the rally to $73.12 on November 6, 2019 ended wave (X). The stock then resumes lower. The structure of the decline from November 6 high is unfolding as a 5 waves impulse Elliott Wave structure. Down from Nov 6 high, wave ((i)) ended at 71.2 and wave ((ii)) rally ended at 73.09. The stock then continues lower in wave ((iii)) towards 68.6 with internal subdivided as an impulse in lesser degree. The bounce in wave ((iv)) ended at 69.50
Exxon Mobil is finishing wave ((v)) of A lower. The stock still can see 1 more marginal low to end the 5 waves down from November 6, 2019 high. Afterwards, the stock should bounce in wave B to correct cycle from November 6 high before the decline resumes. Potential target to the downside is 100% Fibonacci extension from September 16, 2019 high which comes at 62.27 - 64.35. As far as pivot at 73.12 high stays intact, expect rally in the stock to find sellers in the sequence of 3, 7, or 11 swing for further downside.
Exxon Mobil 1 Hour Elliott Wave Chart
 

Elliottwave-Forecast

Master Trader
Feb 17, 2017
2,451
9
84
www.elliottwave-forecast.com
Kirkland Lake Gold Ltd. (NYSE: KL) is gold mining growing company with highly productive yet low-cost mining operations in Canada and Australia.
On October 9, Kirkland Lake announced record production for its third quarter of 2019. President and CEO Tony Makuch said, “Q3 2019 was our best quarter to date driven by exceptional results at Fosterville and a solid quarter of performance at Macassa.” It posted record cash flows and net earnings per share for Q3 2019. The company credits strong production growth and better unit costs.
Since IPO, KL traded higher within an impulsive Elliott Wave structure which is still in progress within the 3rd wave as cycle from 2016 low has an incomplete number of swings. Currently, the stock reached equal legs area $48.78 - $60.90 from September 2018 low and it's expected to end wave (3) of III around that area followed by a 3 waves pullback before resuming the upside.
KL has been trading within a sideways range in the recent 2 month and after the good Earnings report it has the potential of breaking higher toward target area $53 - $56 as long as $43 low is holding. If it fails to break higher, then wave (3) could be already in place and Kl can do a double three correction lower toward equal legs area $40.8 - $38.6 before buyers show up again for 3 waves bounce at least. Consequently, traders can look for buying opportunities during pullbacks in 3 or 7 swings as the overall picture for the stock remain supported within a bullish trend.
KL Weekly Chart 11.07.2019
KL Kirland Lake Weekly Chart
 

Elliottwave-Forecast

Master Trader
Feb 17, 2017
2,451
9
84
www.elliottwave-forecast.com
In this technical blog we’re going to take a quick look at the Elliott Wave charts of USDCAD published in members area of the elliottwave-forecast . As our members know, USDCAD ended cycle from the 1.30122 low as 5 waves structure. We got 3 waves pull back , when the price reached Equal Legs – Blue Box. Commodity pair found buyers there as we expected. In further text we’re going to explain Elliott Wave Forecast.
USDCAD 4 Hour Elliott Wave Analysis 10.26.2019
USDCAD is correcting the cycle from the 1.30122 low. Pull back has reached important technical zone - equal legs area A-B red at 1.30927-1.3032 ( marked blue box). The price structure of the pull back already showing enough number of swings, and turn can happen any moment. As our members know, Blue Boxes are no enemy areas , giving us 85% chance to get a reaction from there. We expected buyers to appear at the blue box for a proposed rally or 3 waves bounce alternatively. As far as the price stays above 1.30122 we expect pair to trade higher
USDCAD
USDCAD 4 Hour Elliott Wave Analysis 11.11.2019
Eventually USDCAD found buyers at 1.30927-1.3032 , the Blue Box area. 1.30122 low held nicely during proposed pull back. We count pull back completed and believe next leg up is in progress. Currently we believe the price is doing wave 3 red of the next leg higher as labeled on the chart.
USDCAD
USDCAD 1 Hour Elliott Wave Analysis 11.20.2019
On the chart below we can see what short term structure looked like on November 20th. The pair is showing higher high sequences in the short term cycles from the 11/05 low. Break of 11/13 peak - wave ((i)) black, made the pair bullish against the 1.3176 low . We expect pair to find intraday buyers in 3,7,11 swings as far as the short term pivot at 1.3176 low stays intact.
Keep in mind market is dynamic and presented view could have changed in the mean time. You can check most recent charts in the membership area of the site. Not every chart is Trading Signal. Best instruments to trade are those having incomplete bullish or bearish swings sequences. We put them in Sequence Report and best among them are shown in the Live Trading Room.
USDCAD
 

Elliottwave-Forecast

Master Trader
Feb 17, 2017
2,451
9
84
www.elliottwave-forecast.com
Some market participants worry that the passing of Hong Kong Human Rights and Democracy Act can reverse the gain in stock market. Both the US Senate and House of Representative overwhelmingly voted 417 to 1 in favor of passing the bill. It is now waiting for President Donald Trump to sign. According to Bloomberg, Trump is expected to sign the legislation rather than veto it. This bill will sanction China's officials who are deemed to harm human rights and freedom in Hong Kong. It will also require US to assess annually whether Hong Kong is sufficiently autonomous to warrant favorable trading status.
Separately, the House also passed another bill called the Protect Hong Kong Act. This bill will ban the export of weapons such as tear gas and rubber bullets to Hong Kong. These measures are mostly symbolic but may alter Washington's relationship with China. Even before this bill, China has accused the U.S as meddling with China's internal affair. Joshua Wong, the poster child of the protest movement, was spotted meeting one of the US consulate employees in Hong Kong. What started initially as a peaceful protest against extradition bill has morphed into violent acts and vandalism.
With the U.S and China currently still negotiating a "Phase 1" Deal, this bill led some market participants to believe that a deal will never happen. They argue that the U.S has insulted China's national honor and thus there won't be any comprehensive trade deal. Consequently, the global economy will suffer greatly as the relationship between two biggest economies in the world worsen. Indeed, there are currently obstacles to reach the agreement as China wants the US to roll back some of the existing tariffs. Trump recently was visibly frustrated and he publicly warned that he can raise the tariffs higher if there is no agreement.
For their part, China has responded to the passing of the bill with strong condemnation and opposition. The following is part of the official response by the Chinese government:
"On November 19th, the US Senate passed the “Hong Kong Bill of Rights on Human Rights and Democracy.” The bill disregards the facts, confuses right and wrong, violates the axioms, plays with double standards, openly intervenes in Hong Kong affairs, interferes in China’s internal affairs, and seriously violates the basic norms of international law and international relations. The Chinese side strongly condemns and resolutely opposes this."
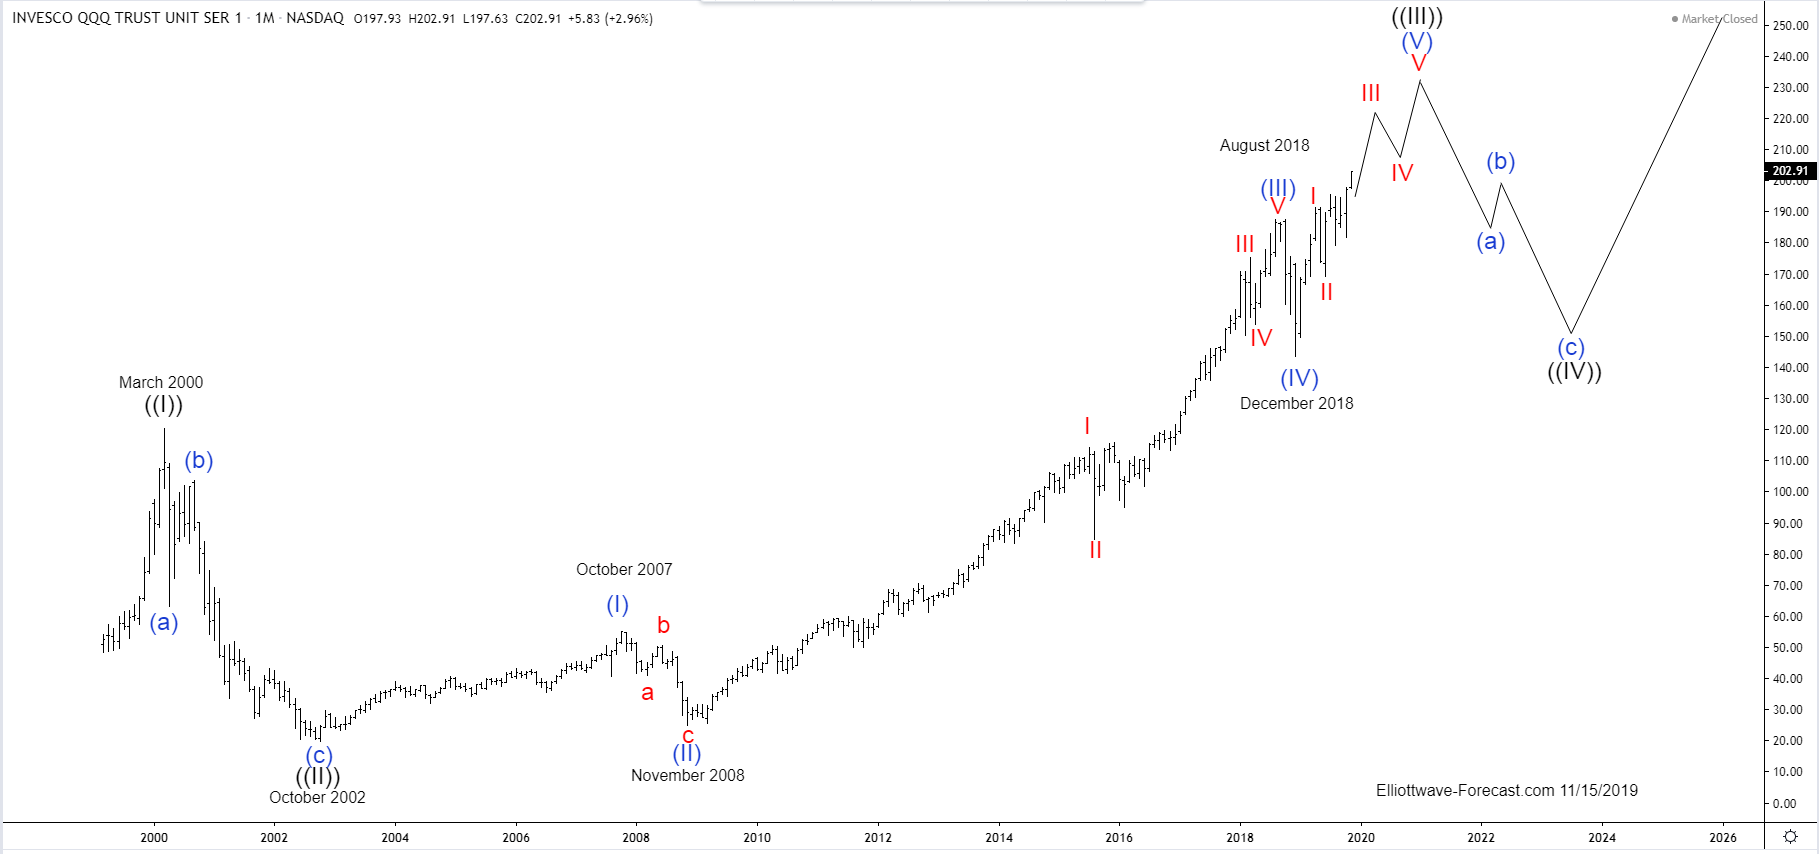
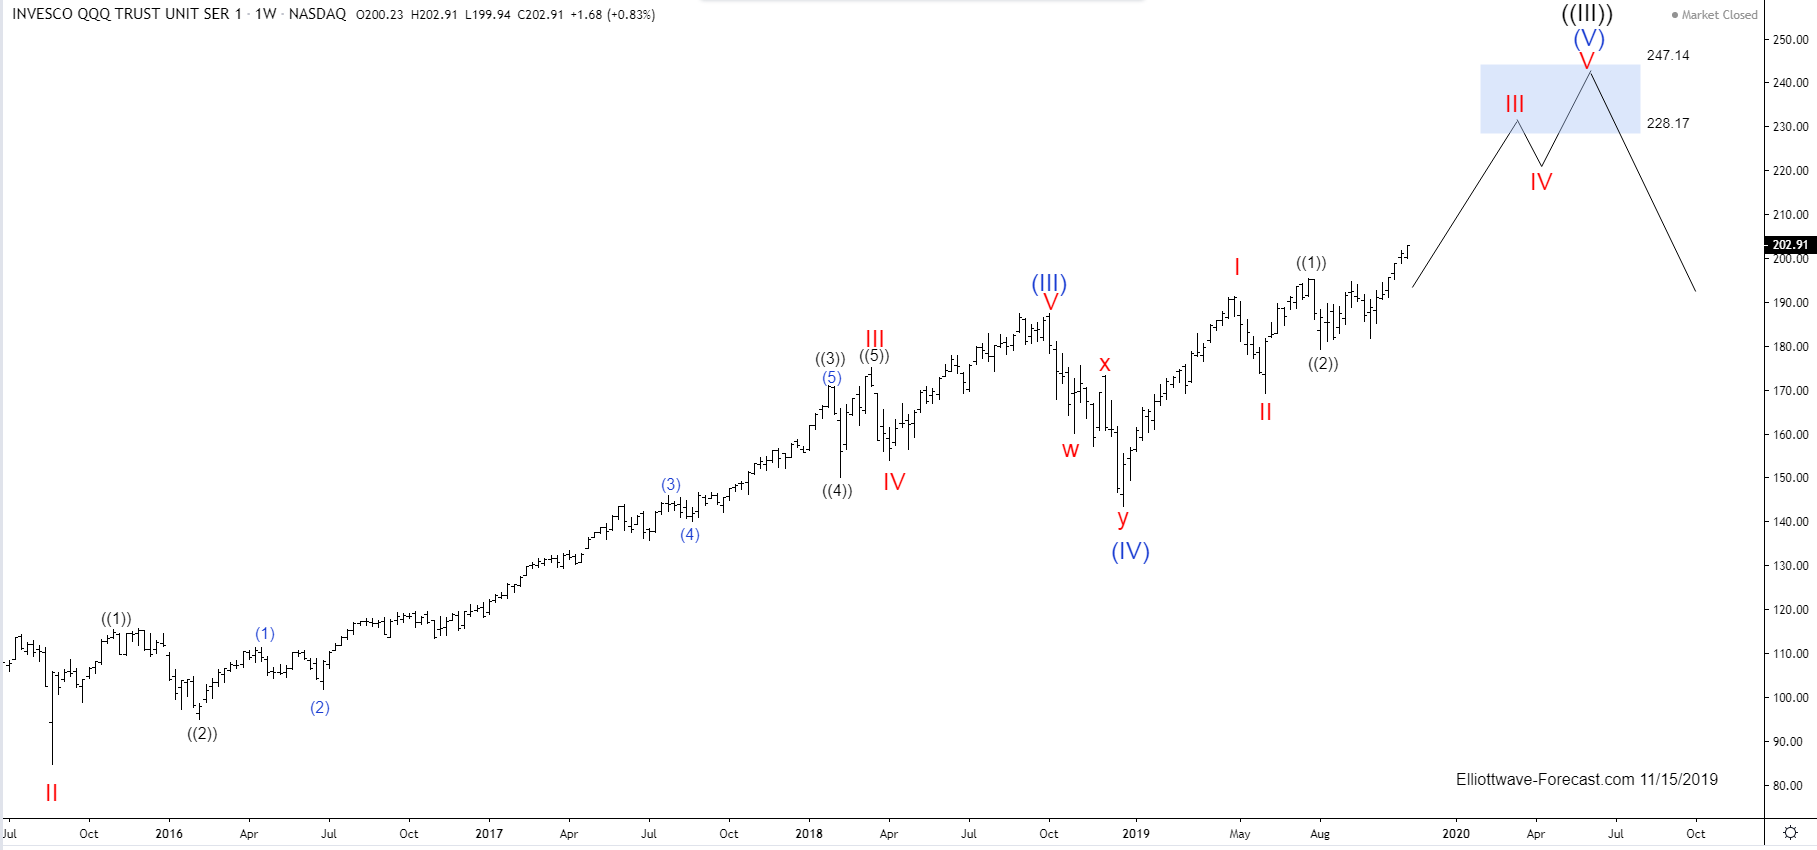
Despite the complexity of the situation, we don't think the passing of the bill will derail the gain in stock market. Based on our technical analysis, pullback in major stock markets exhibit corrective characteristics. Thus, we still conclude the bullish bias remains intact for now. Dips should continue to provide opportunity to buy in the sequence in 3, 7, 11 swing. Below we will take a look at a couple of charts to determine the structure of the latest decline.
Russell 1 Hour Elliott Wave chart
Stock market remains bullish with decline showing corrective characteristic
We can see from above chart that the decline in Russell from wave 3 high still shows a clear overlapping corrective characteristic. We believe the Indices remain firmly bullish. Pullback should find buyers in the sequence of 3, 7, 11 swing.
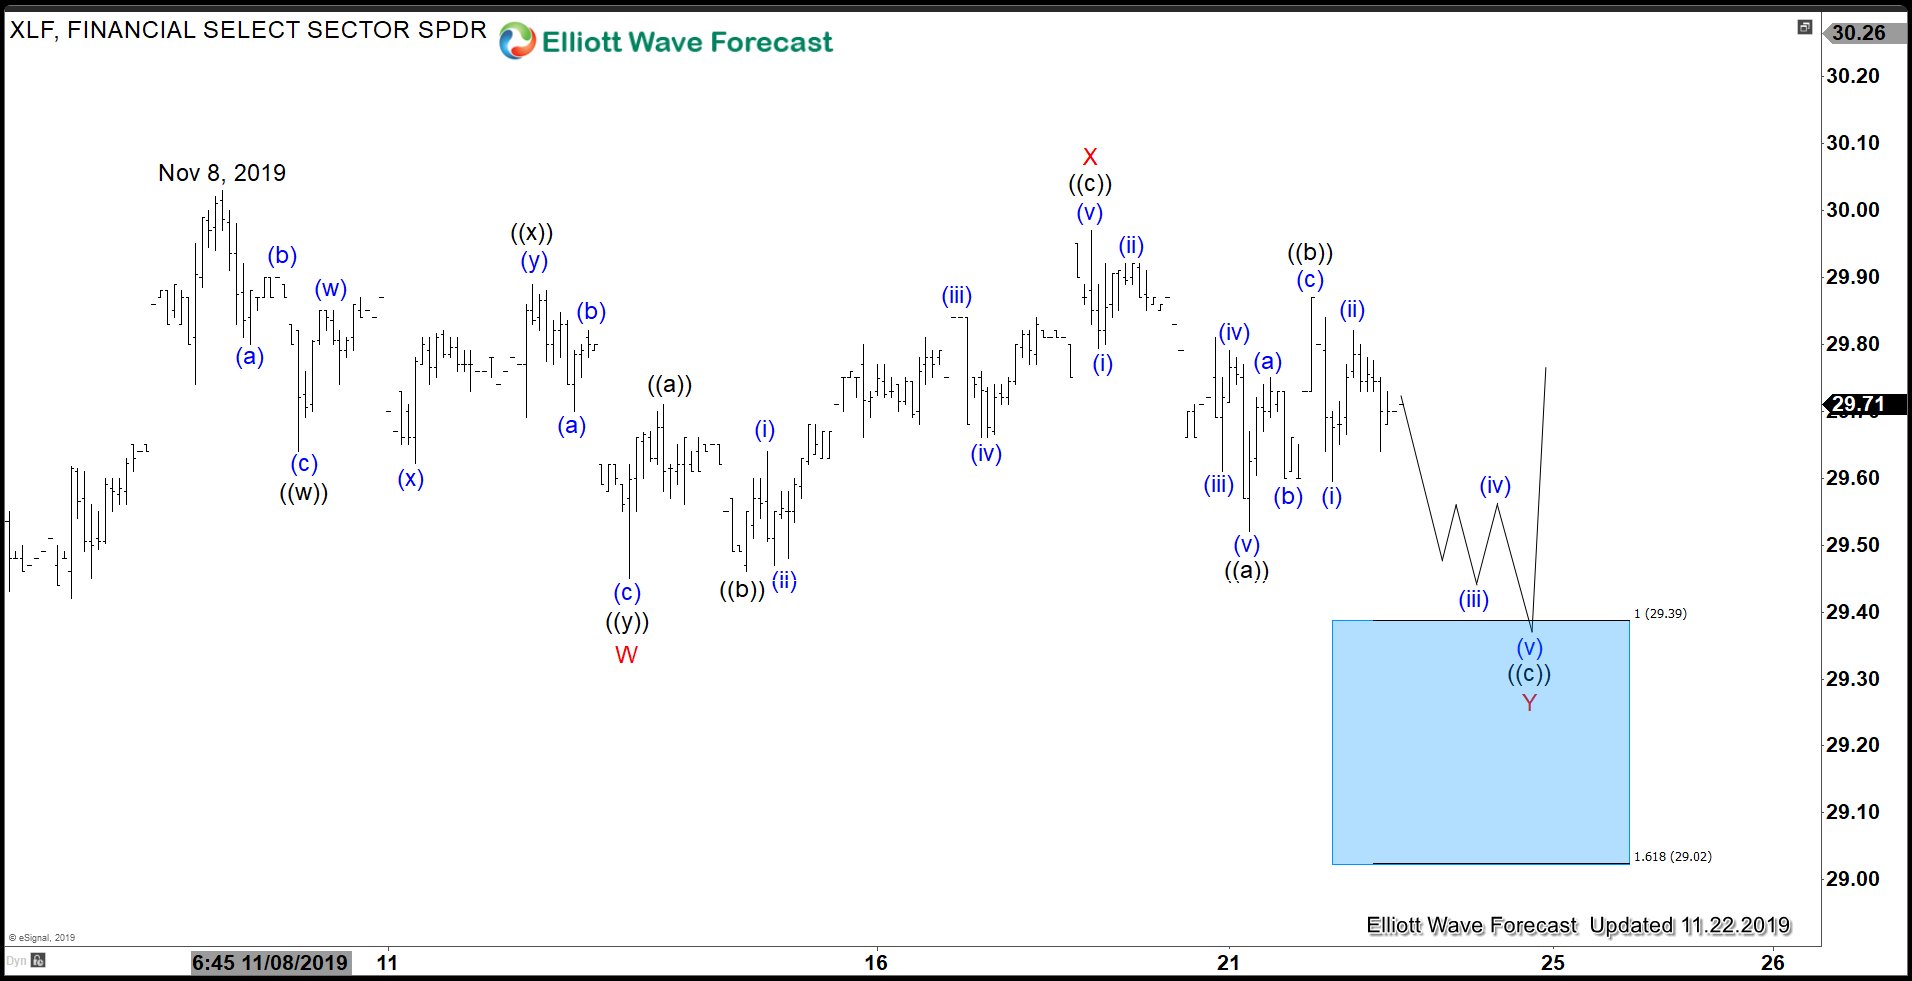
XLF 1 Hour Elliott Wave Chart

Above is the 1 hour chart of XLF, which is the Financial Sector ETF. The decline from November 8, 2019 high is also overlapping and 3 waves. This suggests that the trend remains bullish. The ETF should see buyers at the blue box above. From there, it should extend higher or bounce in 3 waves at least.
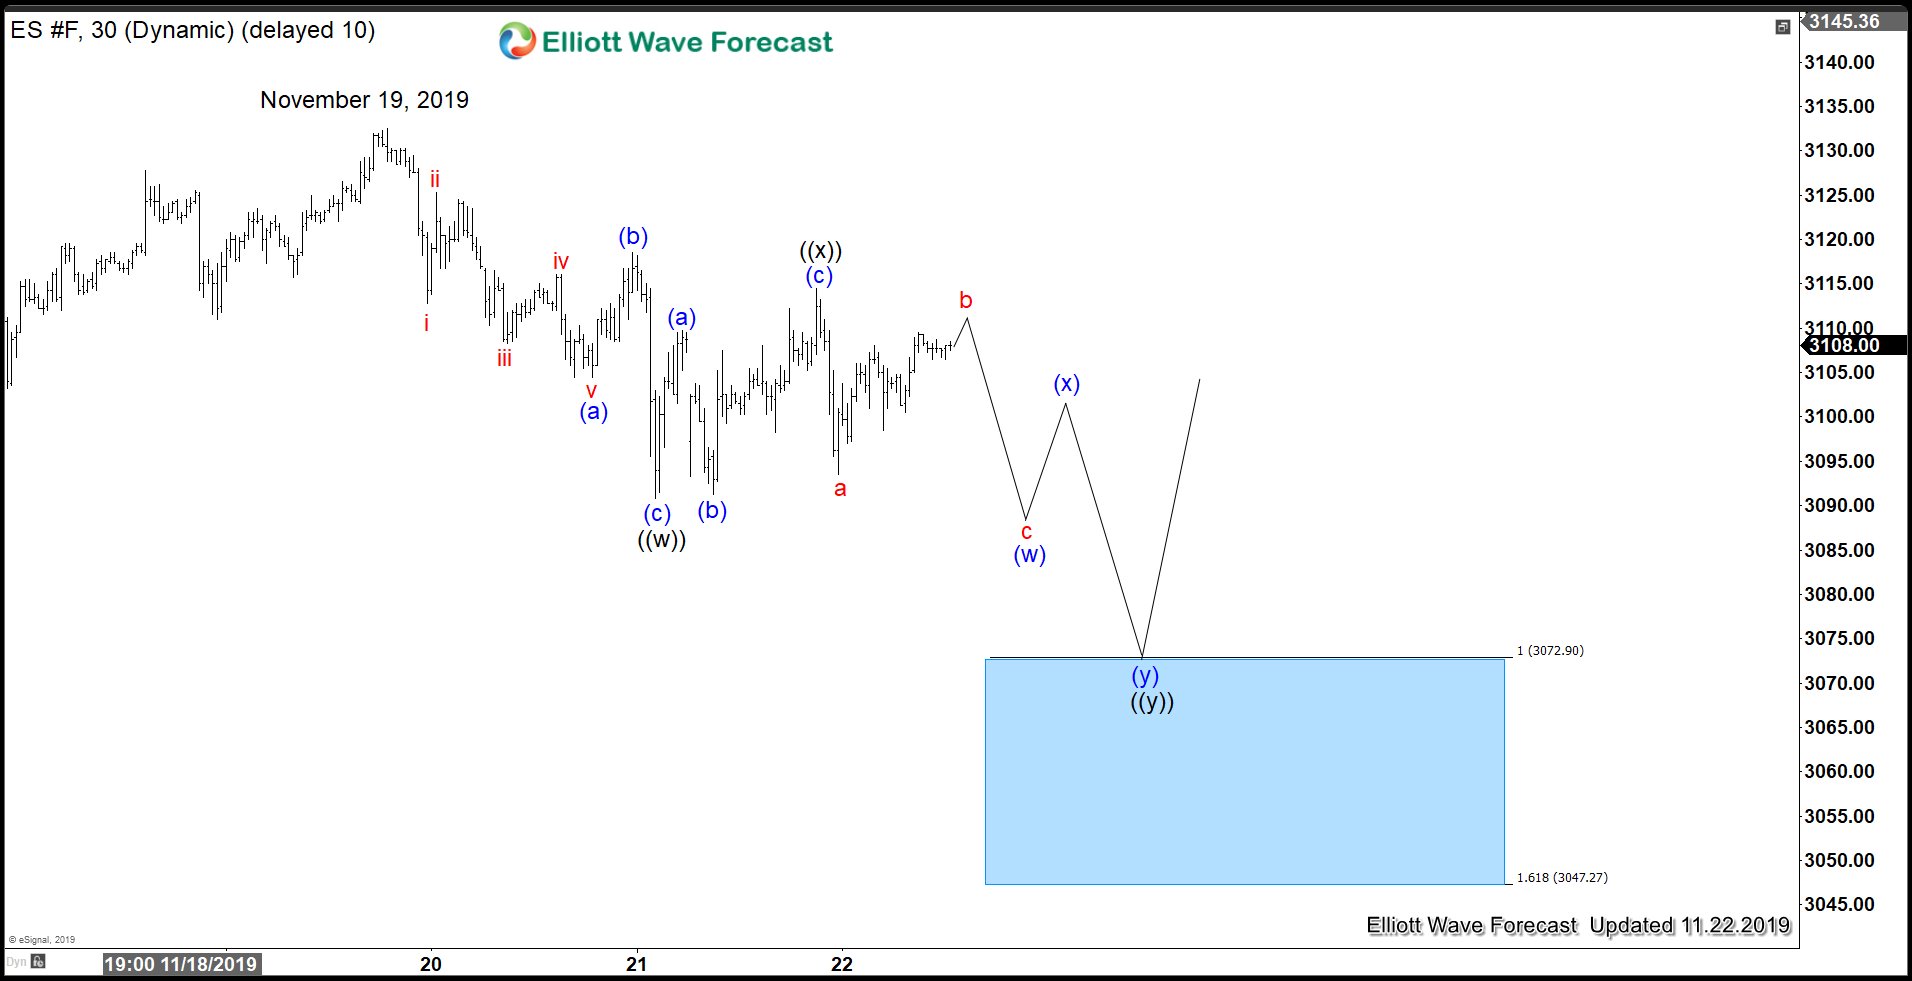
ES_F 1 Hour Elliott Wave Chart

Latest decline in S&P 500 Future (ES_F) from November 19, 2019 high is in 3 waves. Therefore, the trend and bias remain higher. If the Index can see another leg lower to do 7 swing, then the next area of support is 3047 - 3072 area. From here, the Index can extend higher or bounce in 3 waves.
Conclusion
By looking at the technical pictures of some instrument above, we can conclude that the current risk-on rally is likely not over yet. We therefore conclude the passing of the Hong Kong Human Rights bill is not enough to derail the current rally in the market. Indeed, China and Hong Kong market actually reacted higher one day after the news about the bill as China's Central Bank injects money into the market. To get regular technical update on Indices, Forex, or commodities, please feel free to try our service
 

Elliottwave-Forecast

Master Trader
Feb 17, 2017
2,451
9
84
www.elliottwave-forecast.com
Short Term Elliott Wave view on Russell (RTY_F) suggests that the Index ended wave 2 at 1463.14. The Index then resumes higher and ended wave 3 at 1613.60. The internal subdivision of wave 3 is unfolding as a 5 waves impulse Elliott Wave structure. Up from 1463.14, wave ((i)) ended at 1530 and pullback to 1500.80 ended wave ((ii)). From there, Index rallied higher to 1582.90 to end wave ((iii)) and wave ((iv)) pullback ended at 1551. The last push higher wave ((v)) of 3 ended at 1613.60.
Wave 4 pullback is currently in progress. Structure of the pullback is overlapping and corrective suggesting the trend remains higher. The internal of wave 4 is subdividing as a double three Elliott Wave structure. Down from 1613.60, wave ((w)) ended at 1579.70 and wave ((x)) bounce ended at 1605. Wave ((y)) of 4 is expected to complete at 1549.94 - 1571.05 blue box area. From there, the Index should extend higher or bounce in 3 waves at least. We don't like selling the Index. As far as pivot at 1463.14 low stays intact, expect dips to find support in 3, 7, or 11 swing and Index to extend higher.
Russell (RTY_F) 1 Hour Elliott Wave Chart
 

Elliottwave-Forecast

Master Trader
Feb 17, 2017
2,451
9
84
www.elliottwave-forecast.com
CHK have been in a tremendous downside trend since peak at 2011 and has already missed an opportunity for a turn. The instrument is showing a very technical decline in 5 waves since the peak at 02.02.2011 and it is showing in the following chart:
CHK Elliott Wave Analysis - Weekly Chart
CHK Weekly Elliott Wave chart


There is no question it is a 5 waves decline and that momentum is lacking which is an indication of a wave 5. We thought back in 2016 that the instrument had seen a low when Oil bottomed and turned higher. We at Elliottwave-Forecast do not claim to be perfect and we believe no body can forecast the Market perfectly. However, we follow a Technical system which consists of sequences, cycles, correlations, distribution and The Elliott Wave Theory, We forecast with something clear, do not force a bias and always be honest to the price action and the Market. At this moment, we believe the path and sequences in XOM are calling more downside still and all depends of how XOM will trade within the next few days or weeks. XOM is holding OIL to rally even when Indices are rallying and one more time is showing that the sequences and cycles rules above everything. We have been calling CHK lower since it took the lows of 2.2018 and consequently the bears gained control again and consequently, we have been looking for current areas. At this moment XOM is showing 5 swings since peak at 04.2019 with divergence which is key, the structure since peak is corrective and consequently needs to erase the divergence, the instrument should be trading into the $64.27-62.00 area soon and depending of how strong the downside will be ending will determine how weak CHK will be. Many traders believe that a forecast always has to work out and never will change, or once you presented a forecast, you can't change it even if you are right after the change. We believe and keep mentioning that forecasting is a process of continuous adjustments. A waver (trader) needs to accept when an idea doesn't work out and adjust, but a trader should never force a bias or fight the market. A trader needs to read the Market and adjust. Market always wins. In this case, XOM is ruling the energy sector and until the divergence is erased the sector will be weak. Watch the following video and understand our idea and the reason why. We are not claiming to be perfect, but we do understand how the market works and having a system which keep us at the right side is good enough to be profitable.
 

Elliottwave-Forecast

Master Trader
Feb 17, 2017
2,451
9
84
www.elliottwave-forecast.com
$EWC iShares MSCI Canada ETF Long Term Cycles & Elliott Wave
Firstly the EWC instrument inception date was 3/12/1996. The iShares MSCI Canada ETF seeks to track the investment results of an index composed of large and mid-sized companies in Canada. This is of course reflected in the price. The best Elliott Wave reading of the long term cycles in $EWC iShares MSCI Canada ETF must presume some lower prices that did not exist prior to the ETF fund inception date.
Shown on the monthly chart, the bullish cycle from all time lows is believed to have ended in November 2007. This is mostly in line with many other broad based ETF's and indices that ended larger cycles near that time. Likewise the steep pullback lower into the March 2009 lows replicated the pullbacks in other ETF & indices instruments. This pullback was strong enough to suggest it had corrected the cycle up from the all time lows. The analysis and commentary continues below the EWC Monthly chart.

Secondly the bounce from the March 2009 lows has not got back above the November 2007 highs as of yet. Compared to other instruments it is lagging. That not to say it will not catch up it is just the way it works out. EWC bounces higher as related instruments are going higher however at a slower pace. Similarly, the instrument corrects cycles in pullbacks lower when the related instruments are doing the same.
The analysis and conclusion as mentioned earlier; Price has not got above the November 2007 highs yet. As the above chart shows it will eventually however will take some time. The cycles remain bullish and the instrument should proceed higher with the related other countries ETF's and indices reflecting the improvements in the progression of mankind.
Thanks for looking. Feel free to come visit our website.
 

Elliottwave-Forecast

Master Trader
Feb 17, 2017
2,451
9
84
www.elliottwave-forecast.com
Elliott Wave View in SPX suggests that the sequence in the index from December 26.2018 low remains incomplete to the upside suggests any dips should remain supported in 3, 7 or 11 swings looking for more upside. Therefore, we don't prefer selling the index. On the short term chart below, the index is rallying higher in a wave 3 as 5 waves impulsive Elliott Wave structure within the cycle from 10/03/2019 low. Up from there, a rally to $3008.29 high ended wave ((i)) as a lesser degree 5 wave structure. Down from there, a decline to $2976.31 low ended wave ((ii)) pullback in lesser degree 3 swings.
Above from there, wave ((iii)) also unfolded as 5 waves impulse structure where lesser degree wave (i) ended at $3014.57 high. Wave (ii) ended at $2991.21 low, wave (iii) ended at $3097.70 high, wave (iv) ended at $3083.26 low and wave (v) ended at $3127.64 high. While wave ((iv)) pullback unfolded as a lesser degree flat structure where wave (a) ended at $3113.47 low. Wave (b) ended at $3125.16 high and wave (c) ended at $3091.72 low. Up from there, wave ((v)) remains in progress looking to extend higher towards minimum extension target i.e inverse 1.236%-161.8% Fibonacci extension area of wave ((iv)) which comes at $3138.92-$3153.86 area to the upside before a pullback in wave 4 could take place. Near-term, while dips remain above $3091.72 low expect index to extend higher.
SPX 1 Hour Elliott Wave Chart
Elliott Wave View: Bullish Sequence Suggests Supported SPX
 

Elliottwave-Forecast

Master Trader
Feb 17, 2017
2,451
9
84
www.elliottwave-forecast.com
Taiwan Semiconductor Manufacturing Company (NYSE: TSM) is the world's largest dedicated independent (pure-play) semiconductor foundry and it's located in the Hsinchu Science and Industrial Park in Hsinchu, Taiwan.
In 2018, TSM spent the year in a corrective structure after it ended the 5 waves advance from 2015 low. The stock did correction unfolded as 3 waves Zigzag Structure which ended in December 2018 low at $34.2 then it turned higher from there breaking to new all time highs.
Up from $34.2 low, TSM initiated an impulsive rally with an incomplete sequence suggesting further upside to be seen for the stock as it's still trading within the 3rd wave higher which is usually the strongest wave within a bullish cycle. The current rally can see further extension higher toward extreme area $55 - $60 from where a 3 waves pullback takes place before the stock resume higher. Consequently, buyers are expected to remain in control and continue looking to buy during pullbacks in 3 or 7 swing as long as 20018 cycle remain in progress.
TSM Weekly Chart
TSM Weekly Chart 11.26.2019
 

Elliottwave-Forecast

Master Trader
Feb 17, 2017
2,451
9
84
www.elliottwave-forecast.com
Elliott Wave View in Nasdaq (NQ_F) suggests that the rally from October 3, 2019 low is unfolding as 5 waves impulsive Elliott Wave structure. On the chart below, we can see wave 3 of the impulse from October 3 low ended at 8379. The pullback in wave 4 ended at 8231 as a zigzag Elliott Wave structure. Wave ((a)) of 4 ended at 8291.50, wave ((b)) of 4 ended at 8348 and wave ((c)) of 4 ended at 8231. Wave 5 is currently in progress as an impulse.
Up from 8231 low, wave ((i)) of 5 ended at 8313.50 and wave ((ii)) of 5 pullback ended at 8233.25. The Index then resumes higher again in wave ((iii)) of 5 towards 8422. Pullback in wave ((iv)) of 5 is proposed complete at 8366.25. Index still needs to break above wave ((iii)) at 8422 to avoid a double correction in wave ((iv)). Near term, while pullback stays above 8231.4, expect Index to extend higher. We don't like selling the Index. Potential target higher is wave ((i)) = ((v)) towards 8447 - 8497. As far as pivot at 8231.4 low stays intact, dips should find buyers in 3, 7, or 11 swing.
NQ_F 1 Hour Elliott Wave Chart
Elliott Wave View: Nasdaq (NQ_F) Extending Higher as Impulse
 

Elliottwave-Forecast

Master Trader
Feb 17, 2017
2,451
9
84
www.elliottwave-forecast.com
Rally in in Russell 2000 (RTY_F) from October 3, 2019 low is unfolding as 5 waves impulsive Elliott Wave structure. The chart below shows wave ((iv)) of the impulse ended at 1579.28. Index is currently within wave ((v)) before ending the cycle from October 3 low. Up from wave ((iv)), wave i ended at 1592.8 and wave ii pullback ended at 1580.60. Index then resumes higher in wave iii towards 1631.3 and wave iv pullback ended at 1619.80. Wave v of (i) is proposed complete at 1636.40.
Index should now pullback in wave (ii) to correct cycle from November 21 low (1579.28) before the rally resumes. We don't like selling the proposed pullback. As far as pivot at 1579.28 stays intact, expect dips to find buyers in 3, 7, or 11 swing for more upside. Alternatively, instead of ending wave (i) of ((v)), the 5 waves move higher from 1579.28 can also complete the entire wave ((v)) already. In this case, Index should then end a larger 5 waves cycle from October 3 low. The pullback will be a larger degree correction to correct the entire 5 waves up from October 3 low before the rally resumes again.
RTY_F 1 Hour Elliott Wave Chart
Elliott Wave View: Russell (RTY_F) Ending Wave 5
 

Elliottwave-Forecast

Master Trader
Feb 17, 2017
2,451
9
84
www.elliottwave-forecast.com
Hello fellow traders. NIKKEI has been very technical recently. The Futures was keep finding buyers at the Equal legs- Blue Box areas. We’re going to take a quick look at the Elliott Wave charts of NIKKEI published in the membership area of the elliottwave-forecast .
NIKKEI ended cycle from the 22427 low as 5 waves structure. We got 3 waves pull back , when the price reached Equal Legs – Blue Box at 23155-22888. NIKKEI found buyers at that area as we expected, but later on, market decided to take less aggressive view. In further text we’re going to explain Elliott Wave Forecast.
NIKKEI 1 Hour Elliott Wave Analysis 11.20.2019
Current view suggests NIKKEI can be still correcting the cycle from the 22427 low. Cycle from the 11/14 low ended as truncation , labeled as wave (X) blue on the chart. As of right now we see 3 swings down from the peak WXY red. However as the current decline from the (X) blue peak looks too deep, we are calling for Double pull back in wave ((4)). We believe that wave ((4)) pull back can be still unfolding as 7 swings pattern toward 22867-22471. That area is next set of equal legs from the 23658 peak, (W) relater to (X). We expect buyers to appear there again, either for further rally or 3 waves bounce alternatively.
As our members know, Blue Boxes are no enemy areas , giving us 85% chance to get a reaction from there. We advise members to avoid selling against the main bullish trend and expect rally to happen from the blue box in 3 waves bounce at least.

NIKKEI
NIKKEI 1 Hour Elliott Wave Analysis 11.27.2019
NIKKEI Futures found buyers at the blue box area as expected. We got nice rally from there and we are calling wave (4) blue pull back completed at 22721. Now, we would like to see further extension higher and break above 11/07 high to confirm next leg up is in progress. Nikkei is not recommended for selling in any proposed pull back, and would like to see proposed break before buying short term dips against the 22721 low.
Keep in mind market is dynamic and presented view could have changed in the mean time. You can check most recent charts in the membership area of the site. Best instruments to trade are those having incomplete bullish or bearish swings sequences.We put them in Sequence Report and best among them are shown in the Live Trading Room.
Nikkei