Elliottwave-Forecast

Master Trader
Feb 17, 2017
2,453
9
84
www.elliottwave-forecast.com
Xilinx (NASDAQ: XLNX) is an American technology company that is primarily a supplier of programmable logic devices. It designs, develops and markets complete programmable logic solutions, including advanced integrated circuits, software design tools, predefined system functions, customer training, field engineering and technical support.

Since the dot com crash, XLNX struggled to recover and it only managed to make new all time highs after 19 years. The stock surged 70% higher this year into the monthly target area $112 - $173 from where investors took profits triggering a correction lower erasing almost all the gains for this year.


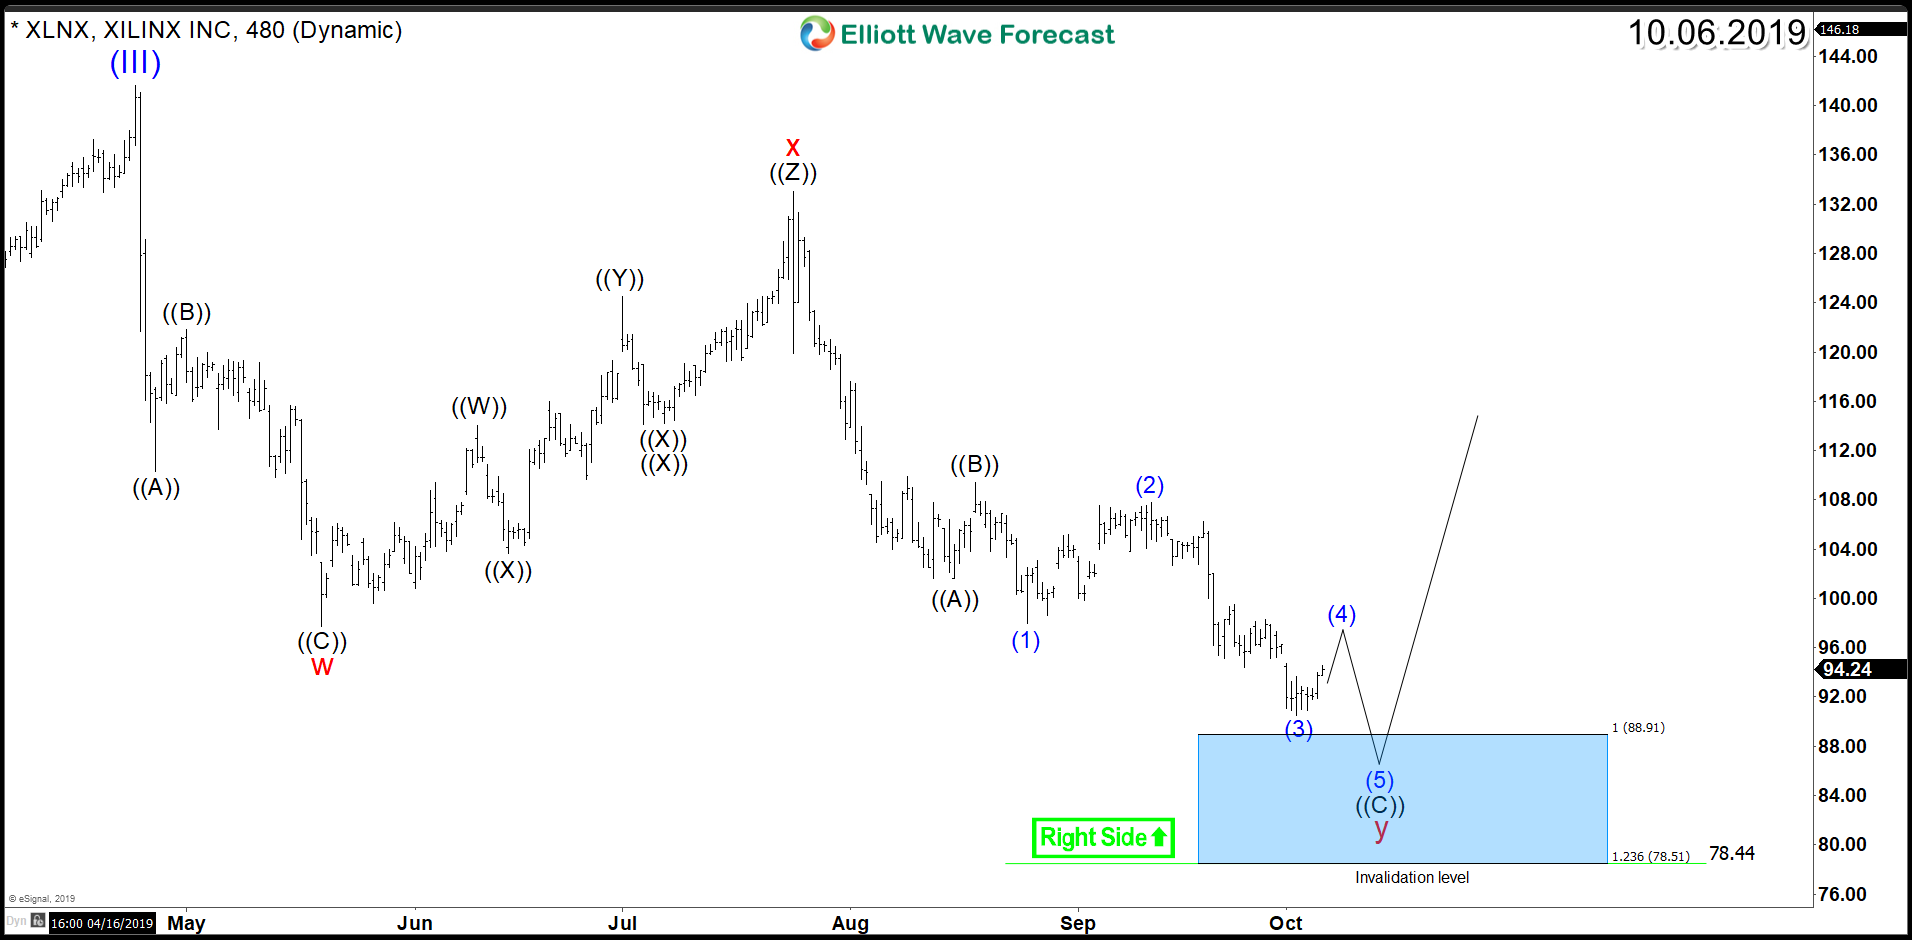
The decline from April 2019 peak is unfolding as 7 swings structure forming the corrective Elliott Wave structure "Double Three" which can still aim for equal legs area $88.91 - $78.51 from where the stock can resume the rally within the main trend and aim for new all time highs. The blue box presented in next chart is a High-frequency area where the Market is likely to end cycles and make a turn. Therefore, XLNX will be looking to find support around that extreme area for 3 waves bounce at least.


Elliottwave-Forecast

Master Trader
Feb 17, 2017
2,453
9
84
www.elliottwave-forecast.com
USO United States Oil Fund Longer Term Cycles & Elliott Wave

Firstly the USO instrument inception date was 4/10/2006. CL_F Crude Oil put in an all time high at 147.27 in July 2008. USO put in an all time high at 119.17 in July 2008 noted on the monthly chart. The decline from there into the February 2009 lows was in three swings. An a-b-c in red although it was a very steep pullback.

The bounce from the 2009 lows is a complex double three combination with a triangle "y". This is w-x-y in red to end the blue wave (x). In either a bullish or bearish market this particular structure always makes a high or low in the initial wave "w". Structures like this will be followed by a contracting or running triangle. In this case the structure ended in June 2014. The decline from those highs were very sharp again. However, this was in three swings again a-b-c in red to end the blue wave (y). This completed a three swing correction (w)-(x)-(y) in blue from the July 2008 highs. That is labeled ((b)) in black at the February 2016 lows.

The analysis continues below the USO Monthly chart.


Secondly CL_F Crude Oil and the USO instrument as previously mentioned made an all time high back in July 2008 then each of them appears to have declined in three big swings into the February 2016 lows. In the case of USO the price was 7.67. The momentum indicators suggest the bounce into the 2018 highs was strong. This suggests it had ended the cycle lower from the all time highs in 2016. Thus I presume those lows will hold long term.

The analysis continues below the USO Weekly chart.


In conclusion: As the USO mirrors CL_F Crude Oil, the bounce from the February 2016 lows into the 2018 highs is strong. Enough it suggests it has ended correcting the cycle up from the all time lows. This leaves a not so pretty Elliott wave impulse into the July 2018 red wave I highs. The decline from the October 2018 ((B)) highs was five waves. This completed a 3-3-5 Elliott wave expanded flat structure at 9.23 in December 2018. Near term the instrument can see some further weakness while below the September 2019 highs noted with a blue (X). The current pullback can continue toward the 9.83 area before turning higher again.
 

Elliottwave-Forecast

Master Trader
Feb 17, 2017
2,453
9
84
www.elliottwave-forecast.com
Elliott Wave view on Gold suggests the rally from August 2018 low last year remains in progress as a 5 waves impulse Elliott Wave structure. On the 1 hour chart below, we can see wave ((4)) of this impulse is proposed complete at 1458.76. Internal subdivision of wave ((4)) unfolded as a double three where wave (W) ended at 1484.2, wave (X) ended at 1535.69 and wave (Y) ended at 1458.76. Gold has since turned higher and the structure of the rally from 1458.76 unfolded as a 5 waves.

Up from 1458.76, wave 1 ended at 1487.3 and wave 2 pullback ended at 1474.3. The yellow metal then resumes higher in wave 3 towards 1502.13, wave 4 pullback ended at 1495.6 and wave 5 ended at 1519.7. The 5 waves move completed wave (1) in higher degree. The metal should pullback in wave (2) to correct cycle from Oct 1 low in 3, 7, or 11 swing before the rally resumes. The yellow metal still needs to break above September 4, 2019 high (1557.1) to rule out the possibility of a deeper correction. We don't like selling Gold.

XAUUSD 1 Hour Elliott Wave Chart


Elliottwave-Forecast

Master Trader
Feb 17, 2017
2,453
9
84
www.elliottwave-forecast.com
In today's blog, we will have a look at the Seabridge Gold stock. The stock is listed in the SP 500.

Seabridge Gold is a Canadian resource gold mining company headquartered in Toronto Ontario Canada. It was founded in 1979 as Copper Mines Ltd. Over the last years, the stock lost 91% of its value. Starting from November 2007 peak. The stock dropped to $3.45 low which marked in July 2015. From its 2007 peak ti reaches the equal legs towards 4.70 area and from there a bigger reaction higher in favor of the stock was expected to take place. It was a perfect equal leg hit. Above from 3.45, it managed to gain over 342% from (3.45 to around 16.79).

Let's have a look at the weekly price action and what to expect for the company.


Seabridge Gold 09.29.2019 Weekly Chart


In the chart above you can see that the stock ended the cycle from 2007 peak at 2015 low. Above from there, Seabridge Gold has been showing strength. Below 2007 peak, it has been in the progress of correcting that in 3-7 or 11 swings. Recently, Seabridge Gold broke above 7/2016 peak opening up a higher high sequence. With that said, the stock has an incomplete sequence from 2015 low indicating that more upside towards 19.85-27.60.

Summarizing, the stock should see more upside in the next weeks into 19.85-27.60. Anyway, as you can see there should be strong in the next years. Of course, nothing runs in a straight line. There will be pullbacks, but those should be supported in the sequences of 3-7 or 11 swings.
 

Elliottwave-Forecast

Master Trader
Feb 17, 2017
2,453
9
84
www.elliottwave-forecast.com
FXY Longer Term Cycles & Elliott Wave

Firstly the FXY instrument inception date was 2/12/2007. The instrument tracks changes of the value of the Japanese Yen versus the US Dollar. There is plenty of data going back into the longer term 1970's time frame available for the currency cross rate in the USDJPY. The foreign exchange pair shows a larger degree time frame low is in place in October 2011 at 75.57. Comparatively, the FXY instrument reflects a price high at 130.22 in October 2011.

The analysis continues below the FXY Monthly chart.


Secondly the FXY instrument mirrors USDJPY price highs and lows inversely as the initial above paragraph suggests. In the FXY instrument the decline from the October 2011 high into the January 2015 lows is an Elliott wave impulse. Internally there are a couple of degrees shown there in the red & blue colors that finished the black wave ((I)). From the January 2015 lows the bounce higher in both price and momentum indicators suggested the cycle lower had ended there.

The analysis continues below the FXY Weekly chart.


In conclusion: As the FXY weekly chart suggests the instrument ended a larger degree cycle in an Elliott wave impulse of five waves lower in January 2015. The bounce from there is in five waves as well however of smaller degree in the wave (a) in blue that ended August 2016. The price action from there has been sideways and in three swing moves. Moreover this leaves the impression the instrument is in a triangle wave (b) in blue. That suggests price will be constricted for some time in between the red "a" 81.33 lows & "b" 91.62 highs. While this plays out with price remaining above the January 2017 lows the FXY can see a turn higher. It can reach the 100.87 - 105.51 area before the larger degree time frame bearish cycle takes over again taking prices substantially lower.
 

Elliottwave-Forecast

Master Trader
Feb 17, 2017
2,453
9
84
www.elliottwave-forecast.com
In this blog, we would take a look at some Yen crosses to gather the bigger picture and also get an idea of whether they are ready for a bounce or there would be more downside before the bounce occurs. We would also look at long-term Elliott Wave sequences two Yen crosses to explain what is expected after the bounce.

NZDJPY Bearish Sequence from 2014 peak
NZDJPY chart below shows pair is showing 5 swings down from 12.2014 peak which is an incomplete bearish sequence and leaves no doubt about that downside is not over yet. However, we do need to be aware of the fact that pair has reached 1.00 - 1.236 Fibonacci extension area down from 7.2017 peak which means selling at current levels is risky as a bigger bounce should soon take place from the first blue box area on the chart. Next bounce is expected to correct the cycle from 7.2017 peak and then pair should turn lower again toward 58.67 - 52.69 area. Near-term another low can still be seen because even where there is enough number of swings and extension in place to call cycle from 7.2017 peak completed, there is no confirmation yet that the bounce has started. At this stage, our preferred strategy is to wait for a larger bounce in 6th swing to develop before looking for selling opportunities.


SEKJPY Bearish Elliott Wave Sequence
SEKJPY chart below shows pair is showing 5 swings down from 1.2014 peak which is an incomplete bearish sequence and leaves no doubt about that downside is not over yet. However, we do need to be aware of the fact that pair has reached 1.00 - 1.618 Fibonacci extension area down from 9.2017 peak which means selling at current levels is risky as a bigger bounce should soon take place from the first blue box area on the chart. Next bounce is expected to correct the cycle from 9.2017 peak and then pair should turn lower again toward 9.009- 7.799 area. Near-term another low can still be seen because even where there is enough number of swings and extension in place to call cycle from 7.2017 peak completed, there is no confirmation yet that the bounce has started. At this stage, our preferred strategy is to wait for a larger bounce in 6th swing to develop before looking for selling opportunities.


Now, the question is are we ready for a bounce? There are enough number of swings in place in NZDJPY and SEKJPY to call the cycles completed from 2017 peaks but nothing has confirmed yet that cycle has ended so we would take clues from the short-term incomplete sequence in $CHFJPY that we have shown on the chart below.

CHFJPY Blue Box can provide the timing for bounce in Yen Crosses
CHFJPY chart below shows that pair is showing 7 swings down from 3.2019 peak but the sequence from 7.2019 peak is still incomplete as we only got 5 swings down from there yet. This means as bounces fail below 9.13.2019 peak, pair should see more downside towards 10.621 - 104.62 area and then start a larger 3 waves bounce at minimum. Based on incomplete sequence from 7.2019 peak in CHFJPY, another low in other Yen crosses could also be seen or they could remain sideways and wait for CHFJPY to reach the blue box before starting the larger bounce. So the blue box in CHFJPY could provide the timing for the bounce to start in the Yen crosses.


Elliottwave-Forecast

Master Trader
Feb 17, 2017
2,453
9
84
www.elliottwave-forecast.com
Short term Elliott Wave view of Amazon ($AMZN) suggests the decline to 1685.06 ended wave (A). Internal of wave (A) unfolded as a 5 waves impulse Elliott Wave structure. On the chart below, we can see wave 3 of (A) ended at 1709.22, wave 4 of (A) ended at 1755.6, and wave 5 of (A) ended at 1685.06. Wave (B) bounce is currently in progress to correct cycle from September 12, 2019 before the decline resumes.

Internal of wave (B) is unfolding as a zigzag Elliott Wave structure. Up from 1685.06, wave A ended at 1747.83 as a 5 waves impulse of lesser degree. Stock then pullback in wave B and ended the pullback at 1702.50. Expect stock to extend higher in wave C of (B) towards 1765.18 - 1804.12 area before stock resumes the decline lower or pullback in 3 waves at least. Potential target to the downside is 100% Fibonacci extension from July 11, 2019 high which comes at 1462 - 1536.

AMZN 1 Hour Elliott Wave Chart


Elliottwave-Forecast

Master Trader
Feb 17, 2017
2,453
9
84
www.elliottwave-forecast.com
XAUUSD Technical Analysis October 12/2019

XAUUSD : Possible bullish patterns are visible on the 4 hour chart. Blue bullish AB=CD pattern already triggered BUYS at the point D AB=CD level on October 1/2019. Price has since bounced higher from this level and is now currently in a correction lower and which can possibly bounce higher in the coming days and weeks. There is also another possible bullish pattern if price does another small push lower. Light blue bullish pattern triggers BUYS at the point D XA 0.886% level. As long as price stays above the October 1/2019 low we should expect another round higher. If looking to trade XAUUSD stops should be placed at the October 1/2019 low and looking for a move higher above the September 4/2019 high. Blue bullish pattern is invalidated if price moves below point D of the pattern and light blue bullish pattern is invalidated if price extends below the point X of the pattern. Overall watch for price to hit the green Target Trend Lines of two other bullish patterns that have already triggered BUYS after the green points 5 terminated. One terminated October 1/2019 and the other has just recently reached the entry trend line.

XAUUSD 4 Hour Chart 10.12.2019


If price moves below the October 1/2019 and stops out the BUY trade then watch for a reaction at the next area of support (see chart below) but traders will need to watch and wait for a reaction/bounce higher at the next support/resistance zone before doing any BUYING.

XAUUSD 4 Hour Chart 10.12.2019


Elliottwave-Forecast

Master Trader
Feb 17, 2017
2,453
9
84
www.elliottwave-forecast.com
GBPAUD Technical Analysis October 12/2019

GBPAUD : Possible bearish patterns are visible on the 4 hour chart. Pink bearish pattern triggers SELLS at the point D XA 0.886% Fib. retracement level and the green bearish pattern triggers SELLS at the point D XA 1.618% Fib. retracement level. Traders need to wait and see if price reacts lower from these levels for more confirmation to start selling the pair. As long as price stays below the May 6/2019 high we can expect moves to the downside. If looking to trade GBPAUD stops should be placed at the May 6/2019 high. A move above the May 6/2019 highs invalidates all bearish scenarios. Conservative traders will watch and wait for more confirmation. Confirmation of GBPAUD topping out will be if the pair breaks below the black Flag/Channel bearish market pattern. A break below the black flag/channel bearish pattern can take the pair lower below the July 30/2019 lows. Only time will tell what GBPAUD will do but for now SELLERS/BEARS should watch and wait for a possible reaction lower. Trade what you see and watch and wait to see if the pair decides to move lower.

GBPAUD 4 Hour Chart 10.12.2019


Of course, like any strategy/technique, there will be times when the strategy/technique fails so proper money/risk management should always be used on every trade.
 

Elliottwave-Forecast

Master Trader
Feb 17, 2017
2,453
9
84
www.elliottwave-forecast.com
In today’s blog, we will have a look at the Vipshop stock. The stock is traded as VIPS at the NYSE.

Vipshop is a Chinese e-commerce company which offers online discount sales which have it's headquarter in Guangdong, China. It was founded in 2008 which means it is a pretty young online company. Vipshop is one of the largest e-commerce sites in China. Over the last years, the stock lost 77% of its value. Starting from its February 2019 peak. The stock dropped to $4.28 low which marked in October 2018. Above from there, it has been now in the progress of a larger recovery.

Let’s have a look at the daily price action and what to expect for the company.


VIPSHOP 10.13.2019 Daily Chart


In the chart above you can see that the stock ended the cycle from 2018 peak at 2018 low. Above from there, Vipshop has been showing strength. Recently, the stock broke above 5/2019 peak opening up a higher high sequence. With that said, the stock has an incomplete sequence from 2018 low indicating that more upside towards 11.16-14.25.

Summarizing, the stock should see more upside in the next weeks into 11.16-14.25. Anyway, as you can see there should be strong in the next years. Of course, nothing runs in a straight line. There will be pullbacks, but those should be supported in the sequences of 3-7 or 11 swings.
 

Elliottwave-Forecast

Master Trader
Feb 17, 2017
2,453
9
84
www.elliottwave-forecast.com
Walmart (NYSE: WMT) is the world’s largest retailer, operating discount stores, supercenters, and grocery stores around the world.

In today's article, we'll taker a look at the short term cycle of the stock based on Elliott Wave Theory :

Back in July 2019, WMT made new all time highs by breaking above January 2018 peak and opened a bullish sequence for the stock from 2015 low supporting a move higher toward target area at equal legs $135 - $168. Since then the stock become more supported in the short term and looking to find buyers in every pullback against $81 low.

The first correction from July peak came in a double three structure which found buyers at the blue box area $106 - $102 before resuming the rally again to new all time highs. The blue boxe in our charts are a High-frequency area where the Market is likely to end cycles and make a turn.

The rally from August 2019 low can be labeled in 2 different ways :

* Leading Diagonal that can produce a larger 3 waves pullback to correct the previous cycle and can reach the 50% - 61.8% Fibonacci retracement area $112 - $110 before buyers appear again to resume the bullish trend or at least bounce in 3 waves as long as $104 low is holding.

* Bullish nest taking place with a small connector already in place at 10/03 low $114.5 and therefore short term pullbacks will remain supported above that level for the stock to continue the rally higher.

In both scenarios, WMT will be a winner as the result of these impulsive structure taking place and consequently traders can looking for buying opportunities in the short term pullbacks in 3 or 7 or 11 swings to join the bullish trend.

WMT 4H Chart ( Diagonal )


WMT 4H Chart ( Nest )
 

Elliottwave-Forecast

Master Trader
Feb 17, 2017
2,453
9
84
www.elliottwave-forecast.com
The last ditch Brexit talks between British and Irish leaders last week yield unlikely breakthrough. Both leaders issued an upbeat statement after the meeting, saying they see a pathway to a possible deal. The issue of Irish border and the proposed backstop has become the bottleneck in Brexit negotiations.

Irish leader Leo Varadkar reportedly said the UK wants a Brexit deal and they can get one by 31 October. Both leaders also believe that a deal is in everybody's best interest. Sterling surged sharply against other major currencies on signs of meaningful progress. Against the US dollar, Sterling climbed to the highest levels in three months, hitting $1.27. The pound also hit a near 1 year high against New Zealand Dollar of $2.003.

However, the excitement faded after European Commission cast doubt about Johnson's proposal. Much uncertainty remains as UK and EU continue to negotiate the deal and time is running out. Both are in intense negotiation this week to reach a deal before the EU summit on Thursday and Friday. There are three possible outcomes:

  1. Brexit Extension
  2. A deal
  3. No deal
$GBPNZD under Brexit Extension Scenario


Under Brexit extension scenario, the pair likely holds below October 2018 high (2.053). It should turn lower again and trading in a sideways range between October 2016 low (1.636) and October 2018 high (2.053). Currently pair has reached 100% extension from Dec 2018 low and waiting for the outcome of the EU-UK negotiation.

$GBPNZD under a Brexit Deal Scenario


Under Brexit deal scenario, $GBPNZD may break above October 2018 high (2.053). A break above the level will create incomplete bullish sequence from October 2016 low, opening up more upside to 2.22 - 2.317 next. One possible strategy is to wait for the break above October 2018 high (2.053) and especially if combined with Brexit deal. In this scenario, pair will become buy in the dips against 1.8122 in 3, 7, or 11 swing.

$GBPNZD under a No Deal Scenario


Under no deal scenario, Sterling can collapse. In the case of $GBPNZD above, it may hold below October 2018 high (2.053). It can then turn lower and break below October 2016 low (1.636) which should open up further downside.

It's difficult to assign the odds of each scenario above. Traders however do not need to speculate on the outcome and can wait for confirmation before entering into positions. We shall let members know how to take advantage and trade it in Live Trading Room when the time comes.
 

Elliottwave-Forecast

Master Trader
Feb 17, 2017
2,453
9
84
www.elliottwave-forecast.com
DAX shows Elliott Wave bullish sequence from August 15, 2019 low (11266.48) favoring more upside. The rally from 11266.48 to 12497.28 ended wave (1) as a 5 waves impulse Elliott Wave structure. On the chart below, we can see wave 3 of (1) ended at 12471.83, wave 4 of (1) ended at 12141.82, and wave 5 of (1) ended at 12497.28. Index then pullback in wave (2) and ended the correction at 11877.32.

Index has resumed higher and broken above wave (1) at 12497.28, signalling the next move higher has started. Up from 11877.32, wave ((i)) ended at 12097.43 and wave ((ii)) ended at 11933.02. Expect Index to see a few more highs before ending wave 1 of (3) a 5 waves from 11877.32. Index should then pullback in wave 2 to correct cycle from October 4 low (11877.32) in 3, 7, or 11 swing before the rally resumes. We don't like selling the Index.

DAX 1 Hour Elliott Wave Chart
 

Elliottwave-Forecast

Master Trader
Feb 17, 2017
2,453
9
84
www.elliottwave-forecast.com
In this technical blog we’re going to take a quick look at the Elliott Wave charts of USDNOK published in the membership area of the elliottwave-forecast . USDNOK broke September 3rd peak , which made the pair bullish against the 8.870 low. Besides that USDNOK made 5 waves up in the short term cycle from the mentioned 8.870 low, suggesting that was the first leg of the new cycle. The pair should find buyers in 3,7,11 swings for 3 waves bounce at least. . Consequently, we advised members to avoid selling the pair and keep on favouring the long side.

USDNOK 1 Hour Elliott Wave Analysis 6.18.2019
USDNOK ended cycle from the 8.870 low as 5 waves structure, labeled as wave 1 red. Now doing wave 2 red pull back that has already reached equal legs area at 9.0559-9.0067. We marked that area as blue box on the chart. At that area we like to be buyers for proposed rally or 3 wave bounce alternatively. Although we expect to see another marginal push down, we advise members to avoid selling against the main bullish trend. We favor the long side from the blue box. As our members know, Blue Boxes are no enemy areas , giving us 85% chance to get a bounce.


USDNOK 1 Hour Elliott Wave Analysis 6.18.2019
The pair found buyers right at the blue box area. We are getting nice reaction from there so far. The bounce has already reached 50 fibs against the ((b)) high. So, members who took long positions should be already risk free from the blue box. At this stage we are calling wave 2 red pull back completed. However we need to see break above 9.1796 high to confirm next leg up is in progress. Otherwise break below 9.0494 would mean wave 2 red is still in progress as 7 swings structure. The price is now right between 9.0494 low and 9.1796 high.

Keep in mind market is dynamic and presented view could have changed in the mean time. You can check most recent charts in the membership area of the site. Best instruments to trade are those having incomplete bullish or bearish swings sequences.We put them in Sequence Report and best among them are shown in the Live Trading Room.


Elliottwave-Forecast

Master Trader
Feb 17, 2017
2,453
9
84
www.elliottwave-forecast.com
USDMXN has been within a multi-year consolidation. Since 2017 peak the pair did a clear impulse lower which is based on the Elliott Wave Theory. The ideal case will be now that we should see another leg lower. The Multi-Year consolidation can be seen with the chart below.


USDMXN Daily Elliott Wave Chart 10.16.2019


The consolidation can give the impression of a triangle, but the consolidation is not contracted in momentum and consequently, it is not a triangle based on our view.

We at Elliott Wave Forecast have added new rules to the existing Theory. We believe that the market has changed since the Theory was developed in the 1930s. Based on our rules a triangle should be contracted in price and momentum. The reason why is after seeing the RSI in the Daily chart. It gives the impression that the pair is nesting since its peak from 06.2018

A nest is a series of 1-2-1-2-1-2-1-2 and can be very close to a bearish break which will take the instrument below the red a which is the low marked in 2017. The following chart is showing the idea.


USDMXN Daily Elliott Wave Chart 10.16.2019


You can see above the nesting in the daily chart and the proposed path. Now the instrument will reach the area between $19.16- $18.94 which the 76.8-100% extension from 8.2019 peak which is is also the trend-line between the lows within a range. So either we react higher and break the highs at 8.29.19 and we extend to retest the peak of red b or the view which we presenting will be taking place and the break lower finally will happen. As always, The Elliott Wave Theory is not a perfect forecasting tool, but using the right additional tools and having an open mind to adjust to current times help traders to remain in The Right Side.
 

Elliottwave-Forecast

Master Trader
Feb 17, 2017
2,453
9
84
www.elliottwave-forecast.com
Bank of America (ticker: BAC) shows an Elliott Wave bullish sequence from August 15, 2019 low, favoring further upside. The decline to 27.19 ended wave (2) and the stock has resumed higher in wave (3). The internal of wave (3) is unfolding as a 5 waves impulse Elliott Wave structure where wave 1 of (3) is expected to complete soon.

Up from 27.19 low, wave ((i)) ended at 28.62, wave ((ii)) ended at 27.46, and wave ((iii)) ended at 30.72. Expect the stock to pullback in wave ((iv)) and turns higher 1 more time in wave ((v)). The 5 waves move higher should end wave 1 of (3). The stock should then pullback in wave 2 to correct cycle from October 3 low (27.19) before the rally resumes again.

We don't like selling the proposed pullback as it's against the direction of right side tag. As far as pivot at 27.19 low stays intact, expect dips to find support in the sequence of 3, 7, or 11 swing for further upside. Potential target to the upside is 100% Fibonacci extension from August 15, 2019 low towards $31.2 - $32.2.

BAC 1 Hour Elliott Wave Chart
 

Elliottwave-Forecast

Master Trader
Feb 17, 2017
2,453
9
84
www.elliottwave-forecast.com
Nikkei shows Elliott Wave bullish sequence from December 26, 2018 low and August 26, 2019 low. This suggests that buyers are in control and favors further upside in the Index. The pullback to 21079 ended wave ((2)) and the Index has resumed higher in wave ((3)). Internal subdivision of wave ((3)) takes the form of a 5 waves impulse Elliott Wave structure.

Wave (1) of ((3)) is currently in progress as a leading diagonal. Up from 21079, wave 1 ended at 21650, wave 2 ended at 21325, wave 3 ended at 22265, and wave 4 ended at 21905. Expect Index to soon complete wave 5 of (1). Afterwards, Index should pullback in wave (2) to correct the cycle from October 3 low before the rally resumes. We don't like selling the Index and expect buyers to appear in the sequence of 3, 7, or 11 swing as far as pivot at 21079 low stays intact.

Nikkei 1 Hour Elliott Wave Chart
 

Elliottwave-Forecast

Master Trader
Feb 17, 2017
2,453
9
84
www.elliottwave-forecast.com
Hello fellow traders. In today’s blog, we will recap a blog I did last month about Lufthansa.

In that blog, I talked about the reasons why the stock should remain weak in the coming weeks and months. Of course, we need to understand that the market never moves in one straight line. There will be pullbacks/bounces, after continuing its trend. Therefore, I was pointing out that the stock was trading at the 61.8 extension area from January 2018 peak. And that the internal cycle from 2/26/2019 peak has ended and correction against that peak should be seen.

Now, let's have a look at the charts and compare them to each other.


Lufthansa AG 09.29.2019 Daily Chart Analysis


Lufthansa AG 10.20.2019 Daily Chart Analysis


In the first chart above you can see that I was expecting a pullback from the first blue box area. If you now see the second chart, you can see nicely that the stock infact started a bounce.

However, it does not change the overall outlook from last month. Lufthansa should ideally now see equal legs from the 2018 peak towards 9.22-5.80 area. This area can be used based on Elliott Wave Hedging for a good buy investment opportunity. Summarizing, the stock should see more downside in the next coming weeks and month into 9.22-5.80 area where a bigger reaction higher in favor of the Lufthansa stock should ideally be taking place. I hope you liked this comparison.