Ascending Channel Pattern
Contents
What is a channel?
A channel is a chart pattern, also known as a parallel channel or equidistant channel, that consists of two parallel lines that connect consecutive highs and lows and contain prices between them. Channels are a popular tool that helps to better identify a trend and predict price actions. Channels are divided into three categories: ascending, descending, and rectangle, depending on the direction of the price move within the pattern and the angle of the channel. In the present guide you will learn about an ascending channel pattern.
What is an ascending channel?
An ascending channel (also known as a rising channel or a channel up) is a chart pattern that consists of two parallel upward-sloping lines. It occurs when a chart has higher swing highs and lower swing lows. Usually, the pattern shows that prices are in an uptrend. In this case, the pattern can be considered bullish. Sometimes, though, an ascending channel may form within a longer-term downtrend. In this case, the pattern most often than not means a pause in the downtrend, though sometimes it is an early sign of a reversal.
How to construct an ascending channel?
To construct an ascending channel pattern, an analyst should draw the lower line first, called trendline, that touches at least two lows. Then a higher line is drawn in parallel to the first line across at least two highs. The more lows and highs each of the lines touches, the stronger the pattern is. The higher line identifies the area of resistance while the lower line shows the area of support. Usually, prices move within the channel, though sometimes they can move outside of the channel for a short while. Traders should be cautious of such false breakouts. Yet a real breakout can be considered a strong buy or sell signal. An upward breakout means that the uptrend is strengthening and is a bullish sign. A downward breakout suggests a trend reversal and is a bearish sign.
How to trade an ascending channel?
There are different strategies that involve the ascending channel pattern. One of them relies on prices staying within the channel and is better to be employed in a low- or medium-volatility environment. It is considered to be safer to go with the trend, buying when prices touch the lower bound of the channel. But those who are willing to risk and be contrarian traders can also sell at the upper bound of the channel. This strategy considers the pattern to be a bullish one and is better employed on longer-term channels.
Yet the more popular strategy is to wait for a breakout. Any breakout is considered a strong signal but usually, traders prefer to sell after prices reverse their movement and close below the lower border of the channel. To avoid false breakouts, it is a good idea to use other technical indicators as well, like MACD or RSI. Traders may also require that a significant increase in volume should accompany a breakout. It is also can be prudent to not enter a position immediately after prices cross the border. Usually, an entry can be made via a short position at 10% of the channel's height below the channel's floor. If prices consistently fail to reach the upper border of the channel for a period of time while touching the lower bound of the channel, that suggests that the uptrend is weakening and a downside breakout is more likely. The usual profit-taking level in case of a breakout is at the channel's height below the channel.
Ascending channel examples
Here are two real examples of trading using ascending channels, one which led to successful trade and another one that did not.
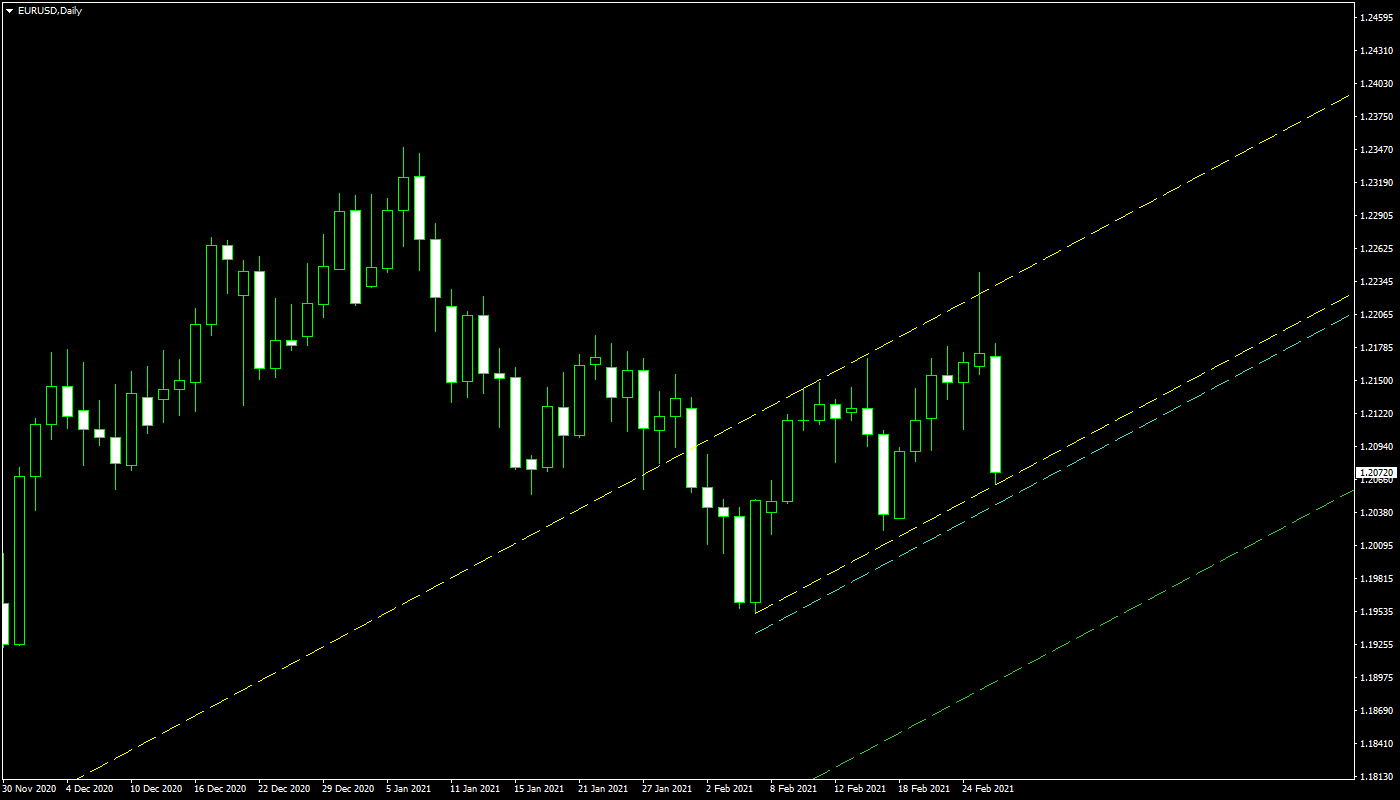
The first example shows an ascending channel (indicated by the yellow lines), which had formed on the daily chart of EUR/USD in February 2021. Betting on a downside breakout, an entry point for a short position was set below the lower border at the level indicated by the cyan line, while the green line shows the intended profit-taking objective.
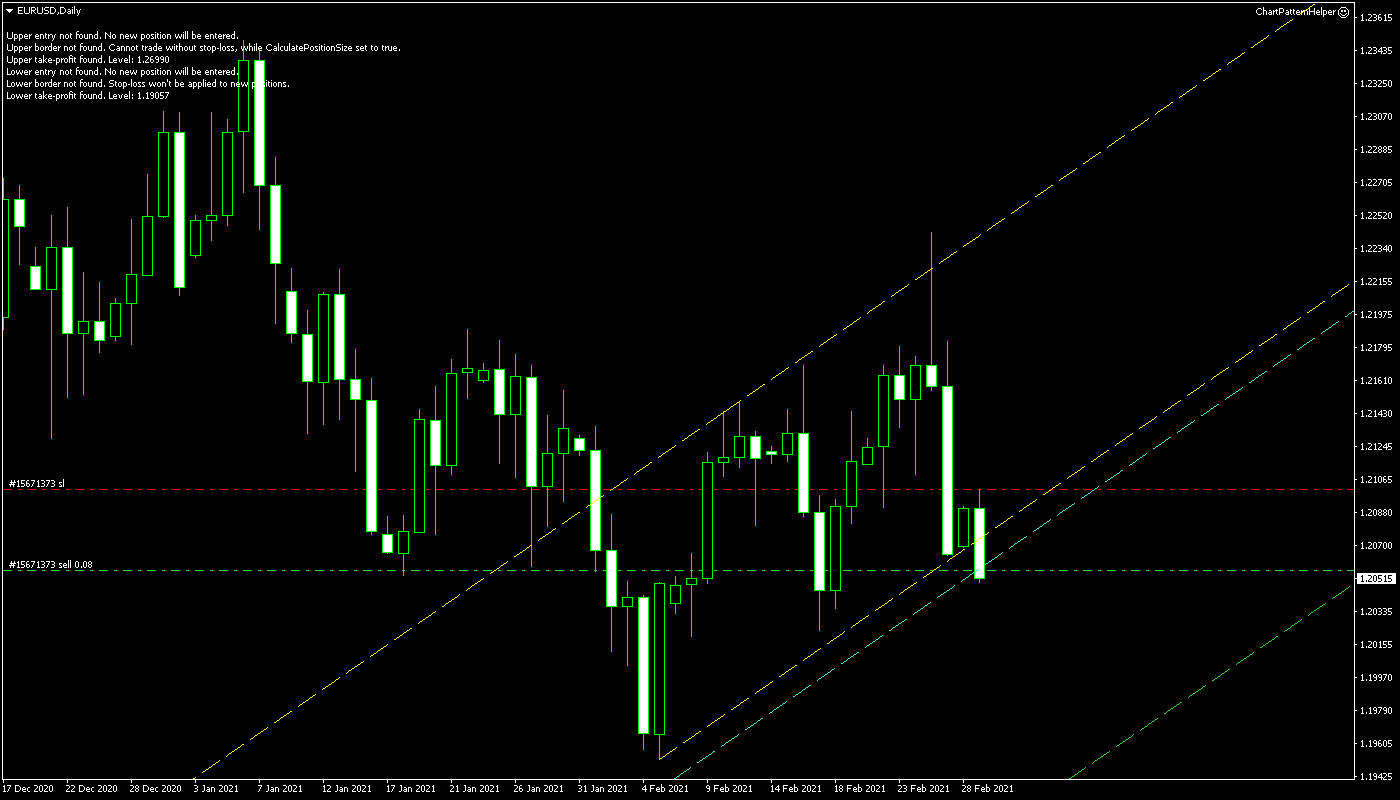
A powerful downside breakout triggered a sell trade.
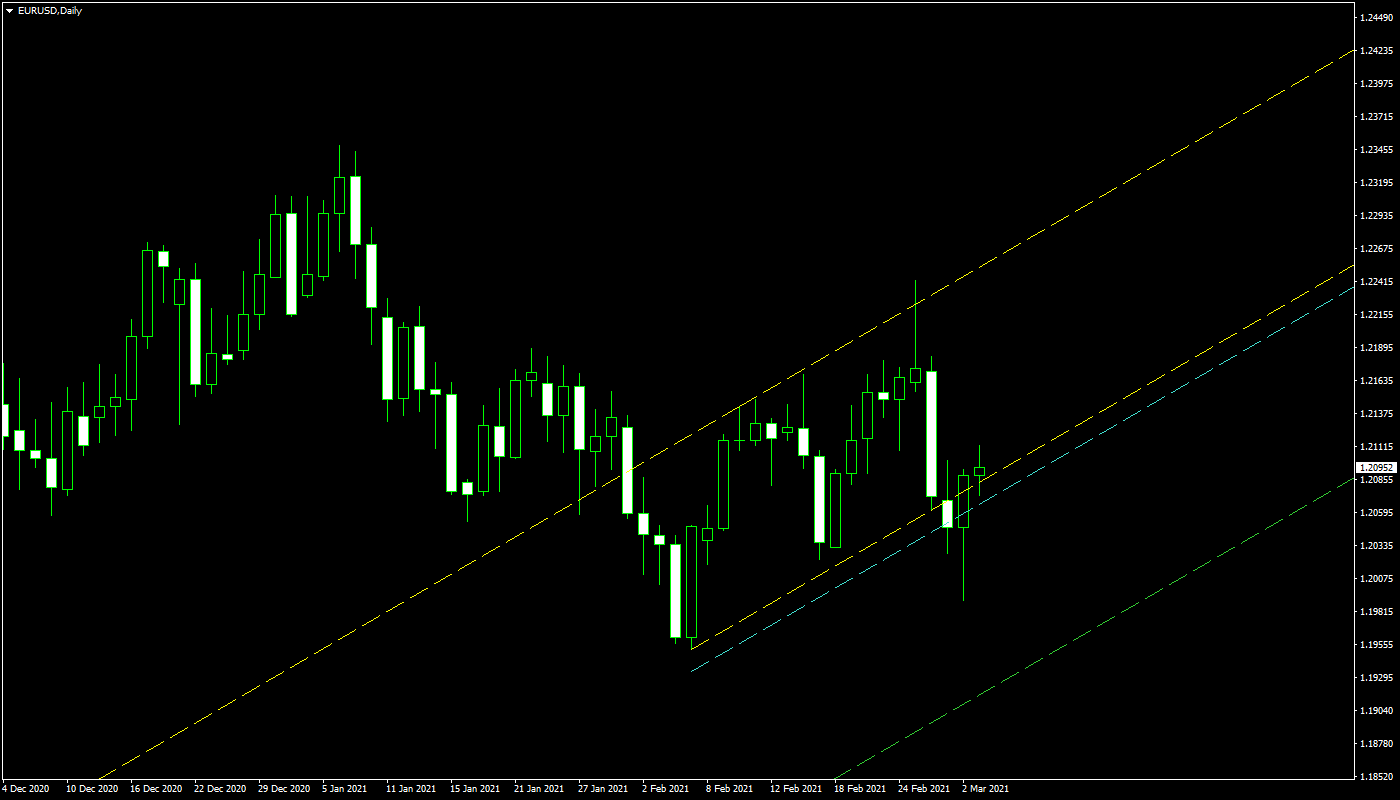
Unfortunately, the breakout was followed by an even bigger pullback, resulting in a failed trade.
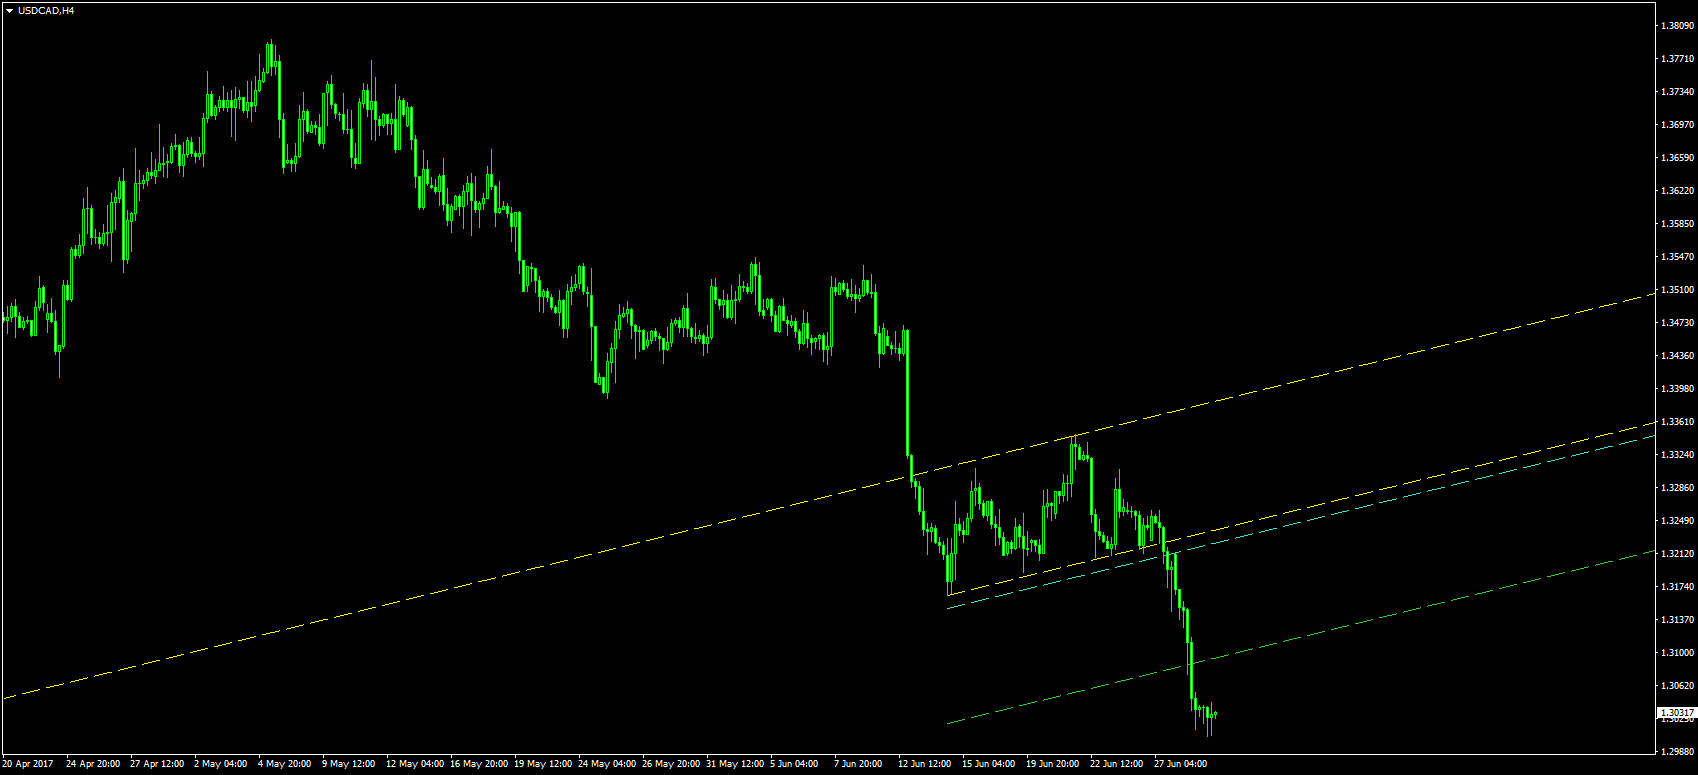
The second example shows a more successful trade using an ascending channel that had formed in June 2017 on the 4-hour chart of USD/CAD. The lines have the same meaning as in the previous chart.
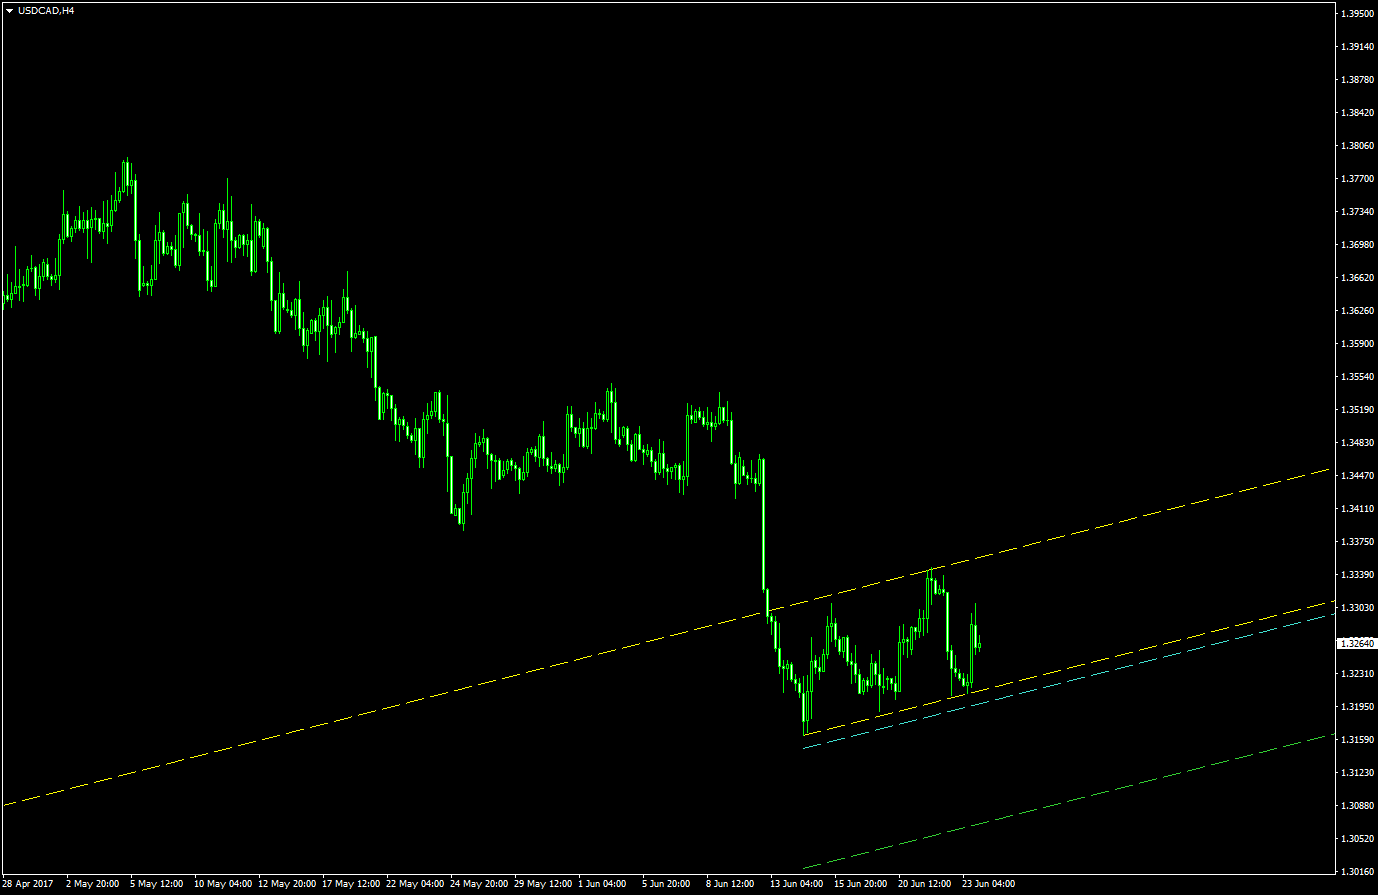
The big slump in the price that followed triggered a sell entry and successfully reached the profit-taking target, resulting in a winning trade.
Conclusion
An ascending channel is a good tool for identifying an uptrend on a longer-term chart or a potential continuation of a downtrend on a shorter-term chart. A breakout below the lower bound of the channel often means that prices will continue to move lower for a while. But as shown in the examples above, it is not always the case. As with any technical indicators, an ascending channel should not be used alone but rather in conjunction with other technical indicators or fundamental analysis.
If you have some questions about ascending channels or using these chart patterns in Forex trading, you can ask them on our forum.
If you want to get news of the most recent updates to our guides or anything else related to Forex trading, you can subscribe to our monthly newsletter.