Trade and Make Money Using Traditional Indicators
Indicators Galore
The marketplace is awash with hundreds of special or custom indicators. And new ones are being made available almost weekly. No doubt they have their use and were developed for a purpose. But their presence, in addition to the standard and custom technical indicators already available on the MT4 platform, can become overwhelming and lead to trading paralysis. You end up not knowing which ones to use. There is too much choice.
Keeping It Simple
It is my belief and experience that the use of say three or four of the most popular and
Moving Averages
Moving averages are commonly used to define trend. Many traders, for example, will use the 200 period MA to indicate an uptrend if price is above the 200 MA or a downtrend if price is below. Alternatively, they will wait for a crossover of, say, the 20 period MA with the 200 period MA – upward cross (Buy), downward cross (Sell).
Unfortunately if you set the MAs too close you get whipsawed, and if you set them too far apart they lag so much that you get in too late and get out too late therefore never making a profit.
My tip is to use offsetting MAs of the same period.
Normally, when you apply a Moving Average to your chart, the dialogue box has these types of settings: Shift is 0; MA method is Simple or, sometimes, Exponential; Apply to is usually set to Close as in the picture below:
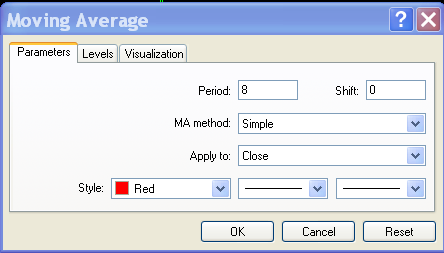
But you can set Shift to any number, say, 8, meaning that the MA will be calculated on the prices 8 periods shifted from normal.
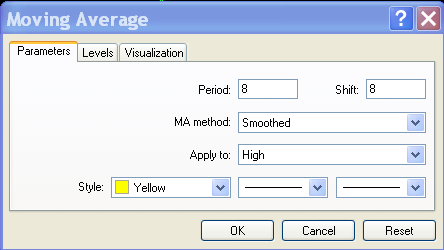
And using the dropdown menus for MA method and Price you can also select for example Smoothed and High as in the picture below:
If you now apply these settings to your chart (except for changing Simple to Smoothed as shown on the first picture), then your chart will look something like this for a M15 AUD/USD chart:
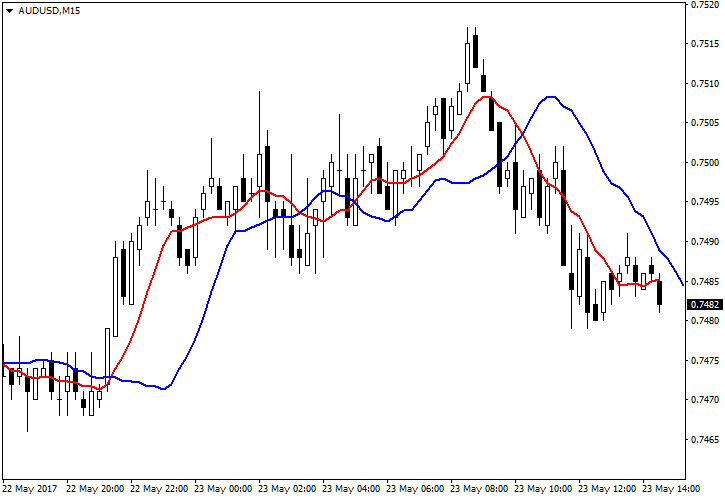
Now, there are some obvious losing trade setups but there are also three very profitable ones, and I have not spent much time in optimizing.
The point I want to make is that by going a little outside the normal settings for MAs, you can design some nice strategies.
And if you were to add in a second filter, like RSI for example, you could also find ways to avoid those little whipsaws like the ones that appear in the middle of the chart above.
Relative Strength Index (RSI)
Most people just always use a Period setting of 14 and then use a value of above 50 for Buy and below 50 for Sell. But that can lead to a lot of whipsaw.
So, on the 15-minute chart, try using RSI with Period = 21 and Levels 55 and 45. Add this as a filter for the trade setups from the MAs as per above and set the rules so that Buys and Sells can only be entered if RSI is between 50 and 55 (Buys) and 45 and 50 (Sells) respectively. That will remove a couple of small whipsaws. The setting of the Levels are quite dependent on whether the currency is trending down or up on the longer term.
MACD
Again, I suggest playing around with the settings for Fast and Slow MA in the MACD settings dialogue box. For instance, if you set Slow at 20 and Fast at 100, you can ride some nice trends even on M15 charts.
MA of RSI
You can also set an MA on the RSI. Then, instead of using the Levels of RSI to indicate a Buy or Sell condition, you can use the cross of the RSI over its MA to do that. Again, experiment with various combinations. For example, an RSI of 21 and an MA of 10. Or whatever. Just look on the chart and see what would work.
In Closing
None of the above suggestions are foolproof. What works for a ranging market may not work too well for a trending market and vice versa. And the cycles of ups and downs will change over time.
So if you use this approach you need to review the settings on a weekly or monthly basis and make the appropriate adjustments.
But at least you are now dealing with only four indicators, and you will get to know them intimately and learn how they respond to differing market conditions.
And as a way of diversifying your risks you can design several strategies for the one currency pair and trade them by using small lot sizes for each rather than one bigger lot size on just once.
And perhaps, also set some realistic take-profit levels rather than always relying on the exit signals.
Keep it simple but also think outside the box.
by Andrew Peters
Andrew Peters writes for DIY Forex Skills community.
If you want to get news of the most recent updates to our guides or anything else related to Forex trading, you can subscribe to our monthly newsletter.