Mastering the Forex Market Structure
Some of you, especially the beginners, gets frustrated by seeing abrupt changes of the market prices without even understanding how to interpret or follow the trends. At times it may seem as if they are things out of the blue.
The good news is that understanding the market structure of the chart will allow you to read price charts and understand entry and exit zones like a pro. It might take effort and time to learn how to interpret price movements, but the benefits outweigh the costs in the long run.
Identifying uptrend and downtrend
The first step is to understand the direction of the market. Is there a trend or a range? And if there is a trend, which direction?
Trend is the overall direction of the market prices for a given period of time. It can be upwards (uptrend), downwards (downtrend) or sideways.
The uptrend is also referred to as bullish trend while the downtrend is also referred to as bearish trend. If the trend is sideways, it is at times referred to as a range, stagnation, or a non-trending chart, meaning there is no trend at that moment.
The trend is a key aspect of the chart because it allows traders to understand the dominant price direction. Typically, price continues with the trend unless there are strong reversal signals appearing on the chart. Recognizing the trend makes it easier for traders to digest and analyze the charts and find profitable trade setups.
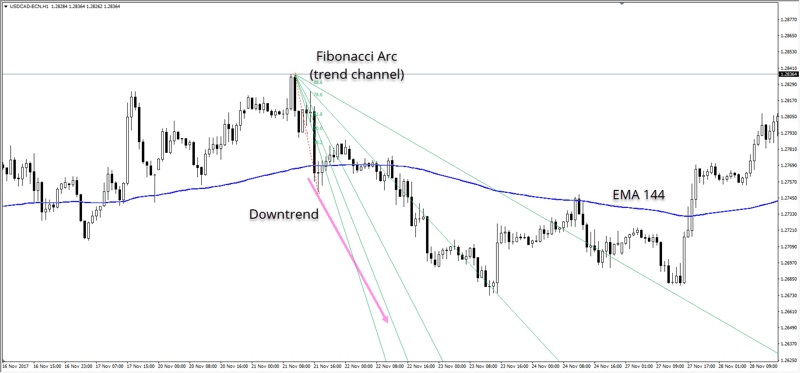
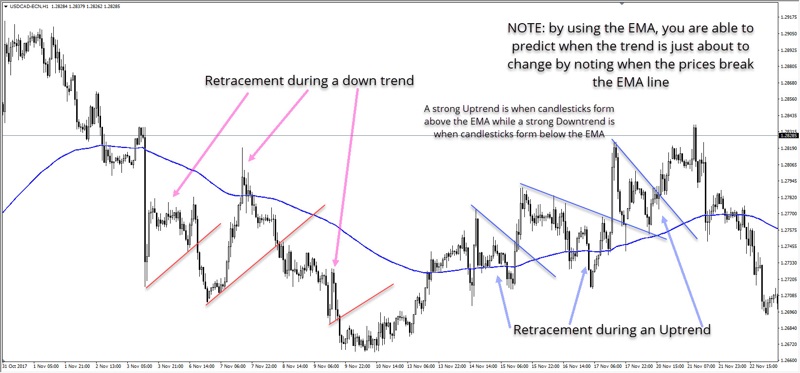
There are various tools, such as trading indicators, which you can use to identify the trend. Examples of such indicators include the moving average (EMA, SMA, LWMA, or SMA) and Fibonacci channels among others.
Spotting support and resistance
The second step in understanding the market movements is by being able to point out the support and resistance levels on your trading chart.
Supports are normally on the lower side where the price bounces back and forms an uptrend while the resistance levels are on the upper side where the price hits and bounces back forming downtrends. As a general rule of thumb, it would be advisable for a trader to open a long position when price hits the support and a short position when price hits the resistance.
S&R levels are crucial since the market prices normally respects them, which often occurs in three different ways:
- Price will either stop and reverse.
- Price will move sideways, which could setup a breakout later on.
- Price will go through the S&R level, which is known as a breakout.
Determining the important support and resistance levels can be quite challenging and it will require the use of the right trading tools such as indicators. Below are examples of indicators that a trader can use to identify the key support and resistance levels.
- Fibonacci retracements.
- Pivot points.
- Bands such as the Bollinger Bands.
- Fractals and moving averages.
Understanding price patterns
The market price usually makes some repetitive movements that form patterns. Such patterns are very crucial to the trader since they provide some important information for prediction purposes. By looking at the patterns, a trader can be able to identify potential reversals, continuation of trends, breakouts, or even trend corrections among many other things.
For example, if there is a bull flag pattern, then the trader is able to predict a continuation of the uptrend. More so, the trader can be much confident of a continuing uptrend if the market prices breakout of the resistance of the bull flag.
There are a number of commonly used patterns, which have been discovered and named, that traders can use. The patterns are normally grouped into several categories depending on the mode of formation. An example of the most commonly known patterns include:
- Candlestick patterns.
- Wave patterns.
- Divergence patterns.
- Chart patterns.
- Breakout, pullback, and continuation patterns.
Since it is at times difficult to identify patterns, you can look for a reliable trading system online and use them for identifying various patterns.
If you want to get news of the most recent updates to our guides or anything else related to Forex trading, you can subscribe to our monthly newsletter.