Daily Technical Outlook

katetrades

Master Trader
Feb 11, 2013
2,557
8
84
Dominica
www.tradersway.com
AUDUSD Ascending Trend Line (Dec 3, 2015)

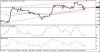
AUDUSD has been moving in a steady uptrend, trading above an ascending trend line connecting the latest lows of price action. Price recently made a swing high near the .7350 minor psychological level before showing signs of a pullback.

A correction could take the pair back down to the rising trend line support, which is near the 61.8% Fibonacci retracement level. A shallow pullback might last until the 38.2-50% Fib levels, with the latter coinciding with the .7250 minor psychological support.

The 100 SMA is starting to cross above the 200 SMA to show that the uptrend is likely to carry on. These moving averages are also climbing near the ascending trend line, potentially adding to its strength as a support area.

Meanwhile, stochastic is making its way down from the overbought region to indicate a buildup in selling pressure. RSI is also heading lower so AUDUSD might follow suit.

Event risks for this trade setup include the release of Australia's trade balance and retail sales figures. The earlier releases from the economy came in stronger than expected, with the GDP showing a 0.9% expansion and the RBA reiterating its shift to a less dovish stance.

As for the US dollar, the upcoming NFP release could spur volatility, although market watchers are bracing themselves for an upbeat surprise since the ADP report and ISM PMI components showed employment gains.

screen_shot_2015_12_02_at_2_47_10_pm.jpg


However, the pickup in risk appetite stemming from the Chinese yuan's inclusion in the IMF SDR is favoring the higher-yielding Australian dollar versus the lower-yielding US dollar for the time being.

By Kate Curtis from Trader's Way
 

katetrades

Master Trader
Feb 11, 2013
2,557
8
84
Dominica
www.tradersway.com
GBPAUD Trend Line Correction (Dec 4, 2015)

GBPAUD has been on a steady downtrend but just enjoyed a nice pop higher after the release of today's set of data from Australia and the UK. This opens the possibility of a correction to the trend line visible on the 1-hour and 4-hour time frames.

Using the Fib tool on the latest swing high and low shows that the 50% Fibonacci retracement level is in line with the trend line and near the 2.0700 major psychological level. This might hold as resistance, allowing GBPAUD to resume its selloff.

The 100 SMA is below the 200 SMA on the 4-hour chart, signaling that the path of least resistance is to the downside. However, stochastic and RSI are both on the move up, which means that buyers are in control of price action for now.

Earlier on, the Australian trade balance release printed weaker than expected results, as a wider deficit was seen due to the 3% decline in exports. Meanwhile, the UK had its first piece of good news all week when its services PMI beat expectations.

Still, the BOE seems to have shifted to a less hawkish stance while the RBA has been sounding less downbeat. The Chinese yuan's addition to the IMF SDR might also yield positive prospects for the Australian economy, as the inflow of funds to China could spur demand for commodity trade.

screen_shot_2015_12_03_at_10_49_40_am.jpg


Up ahead, Australia is still set to print its latest retail sales report and strong results could yield to another leg higher for the Aussie. Analysts are expecting to see a 0.4% gain but a higher reading could allow GBPAUD to drop back to the previous lows below 2.0400.

By Kate Curtis from Trader's Way
 

katetrades

Master Trader
Feb 11, 2013
2,557
8
84
Dominica
www.tradersway.com
EURAUD Downtrend Setup (Dec 7, 2015)

EURAUD has been in a steady downtrend on its longer-term time frames, with a descending trend line connecting the latest highs of price action. Price made a sharp pop higher after last week's ECB rate statement but it looks like the falling resistance area is still holding.

This trend line coincides with the dynamic resistance at the 100 SMA, which is below the longer-term 200 SMA and indicating that the downtrend is likely to carry on. In addition, stochastic and RSI moving down from the overbought zones so sellers are ready to take control.

However, the latest formation near the trend line looks like a bullish flag so there might be a chance for an upside breakout. In that case, a reversal from the previous selloff could take place.

There are no major releases out of Australia or the euro zone today, which favors the odds of the longer-term trend resuming. Still, the release of German industrial production data and the euro zone Sentix investor confidence index might provide some volatility if the actual numbers come in above or below expectations.

Analysts are expecting to see a 0.8% rebound in German industrial production, erasing part of the previous 1.1% decline. The euro zone Sentix investor confidence index is slated to rise from 15.1 to 17.2 to reflect stronger confidence.

screen_shot_2015_12_06_at_6.jpg


Later on in the week, data from China could have an impact on the Aussie's price action, as the CPI and trade balance numbers are due. Stronger than expected results could renew demand for the Aussie, especially since the yuan's addition to the IMF's SDR could spur better performance from the Chinese economy.

By Kate Curtis from Trader's Way
 

katetrades

Master Trader
Feb 11, 2013
2,557
8
84
Dominica
www.tradersway.com
NZDUSD Resistance Turned Support (Dec 8, 2015)

NZDUSD has recently broken past a key resistance level at the .6600 major psychological mark then zoomed up close to the .6800 handle before showing signs of a pullback. Using the Fib tool on the latest swing high and low shows that the 61.8% retracement level lines up with the area of interest.

Stochastic and RSI are both on the move down, indicating that sellers are in control for the time being. However, both oscillators are already nearing the oversold region and a turn higher could indicate a return in bullish momentum.

In addition, the selloff appears to be slowing with a few spinning tops being formed. If the .6600 area holds as support, a bounce back to .6800 might take place.

The main event risk for this trade is the RBNZ interest rate decision, during which some analysts are expecting to see another 0.25% rate cut. After all, RBNZ head Wheeler mentioned that some further reduction in the OCR seems likely in their previous rate statement.

Still, the New Zealand economy has actually posted some improvements in the past few weeks, leading some to believe that further easing is no longer necessary. Dairy prices have posted a rebound while consumer spending has been much stronger than expected in Q3.

nzdusd.jpg


Other event risks include the release of US retail sales data, with stronger than expected results likely to fuel rate hike speculations. This has been positive for risk sentiment recently, so it might also add to the Kiwi's gains.

By Kate Curtis from Trader's Way
 

katetrades

Master Trader
Feb 11, 2013
2,557
8
84
Dominica
www.tradersway.com
EURGBP Long-Term Range (Dec 9, 2015)

EURGBP recently made a strong bounce off the bottom of its long-term range at the .7000 major psychological level and appears to have enough momentum to make it back to the top. If resistance at the .7400 handle holds, price could head back down to the range support.

At the moment, EURGPB is still at the middle of its range while technical indicators are suggesting further upside. The 100 SMA is below the 200 SMA at the moment, but the short-term moving average looks ready to make an upward crossover.

Stochastic is on the move up, which suggests that buyers are still in control. However, this oscillator and the RSI are nearing the overbought area, indicating that selling pressure could resume soon.

Event risks for this setup include the BOE interest rate statement towards the end of the week. No actual policy changes are expected for now, but policymakers could reiterate their downbeat remarks from their previous announcement.

The MPC minutes are up for release at the same time, and this should provide more insight on policymakers' bias. If the vote to keep rates on hold turns out unanimous this time, the pound could see more selling pressure and possibly break past the EURGBP resistance.

eurgbp.jpg


As for the euro, a number of medium-tier reports are up for release but these aren't likely to make a huge dent on the euro's price action. Manufacturing production data from the UK was weaker than expected today, as it reflected a 0.4% decline instead of the projected 0.1% dip.

By Kate Curtis from Trader's Way
 

katetrades

Master Trader
Feb 11, 2013
2,557
8
84
Dominica
www.tradersway.com
USDJPY Range Breakdown (Dec 10, 2015)

After being stuck inside a range for quite some time, USDJPY finally picked a direction and broke to the downside. This suggests that further losses might be in the cards for this pair.

The range is approximately 100 pips in height so the resulting breakdown could be of the same size, possibly taking the pair down to the 121.50 mark or much lower. Stochastic and RSI already nearing the oversold area so profit-taking might take place soon.

However, the 100 SMA looks prime for a downward crossover, possibly signaling that a downtrend is brewing. A bounce off the nearby support areas could simply spur a retest of the broken support before more bears push the pair back down again.

Event risks for this trade include the release of US retail sales data on Friday, with weak readings likely to spur more losses for the currency. Risk aversion has been in play these days, although the lower-yielding Japanese yen has outpaced the safe-haven US dollar lately.

As for Japan, only medium-tier reports such as PPI and BSI manufacturing index data are lined up. Earlier in the week, the GDP reading enjoyed an upward revision from -0.2% to +0.3% to indicate that the economy didn't really suffer a recession.

usdjpy.jpg


In addition, manufacturing data yielded stronger results, with core machinery orders surging by 10.7% instead of falling by 1.5% as expected.

By Kate Curtis from Trader's Way
 

katetrades

Master Trader
Feb 11, 2013
2,557
8
84
Dominica
www.tradersway.com
AUDUSD Broken Trend Line Retest (Dec 11. 2015)

AUDUSD recently made a strong downside break from its ascending trend line connecting the recent lows on the 4-hour time frame. This suggests that a reversal is in order, after price completes its pullback to the broken support.

The broken trend line coincides with the 61.8% Fibonacci retracement level on the latest swing high and low. If this keeps gains in check, price could resume its drop to the swing low at .7170 or much lower.

The area of interest also lines up with the moving averages, which might add an extra layer of resistance. In addition, the 100 SMA crossed below the 200 SMA to indicate that a downtrend is brewing.

Stochastic is already heading down from the overbought zone, which suggests that buyers are taking a break and letting sellers take over from here. RSI is also pointing south and AUDUSD might follow suit.

Event risks for this trade setup include the US retail sales release on Friday's US trading session, although stronger consumer spending numbers are expected. Jobs data from Australia actually surprised to the upside but the reliability of the results have been in question for quite some time so the gains weren't sustained.

Earlier in the week, China printed downbeat trade figures, reflecting a decline in domestic demand. This could mean lower shipments of raw material products from Australia, possibly weighing on the country's export levels.

audusd.jpg


In addition, iron ore prices have fallen to record lows, signaling weaker revenues for Australia's exporters. Further commodity price declines could keep weighing on the Australian dollar and overall risk sentiment.

By Kate Curtis from Trader's Way
 

katetrades

Master Trader
Feb 11, 2013
2,557
8
84
Dominica
www.tradersway.com
GBPUSD Rising Wedge Pattern (Dec 15, 2015)

GBPUSD has been slowly trending higher, moving inside a rising wedge pattern visible on its 4-hour time frame. Price is currently testing the wedge support and might be due for a bounce back to the top.

Stochastic and RSI are both moving out of the oversold region, indicating a return in buying pressure. This could take GBPUSD up to the wedge resistance at the 1.5250 minor psychological level or possibly an upside breakout.

If price breaks past the wedge resistance, the pair could rally by an additional 300 pips or the same height as the chart formation. The 100 SMA lines up with the bottom of the wedge, adding more support, and is above the 200 SMA and indicating that the path of least resistance is to the upside.

Event risks for this trade setup include the FOMC statement, during which the Fed is widely expected to hike interest rates. Still, the announcement could be accompanied by cautious rhetoric, which might still leave the dollar weaker against its peers.

Another potential catalyst is the UK jobs report, which might show a 0.9K rise in claimants, enough to keep the unemployment rate steady at 5.3%. The average earnings index might fall from 3.0% to 2.5% to indicate weak wage pressures, likely weighing on the pound.

If so, GBPUSD could break below the wedge support around 1.5100-1.5150, taking it lower by an additional 300 pips to the 1.4800 levels.

By Kate Curtis from Trader's Way
 

Attachments

  • Screen Shot 2015-12-14 at 10.40.45 AM.jpg
    Screen Shot 2015-12-14 at 10.40.45 AM.jpg
    54.8 KB · Views: 37

katetrades

Master Trader
Feb 11, 2013
2,557
8
84
Dominica
www.tradersway.com
AUDUSD Complex Head and Shoulders (Dec 16, 2015)

AUDUSD might be in for a long-term reversal from its previous uptrend, as a complex head and shoulders can be seen on its 4-hour time frame. Price is currently testing the neckline near the .7150 minor psychological level, with a breakdown likely to push the pair lower by an additional 200 pips or the same height as the chart formation.

Both stochastic and RSI are coming from middle ground and turning lower, indicating weak bearish pressure. Still, if sellers are able to stay in control, a downside break could take place sooner or later.

However, the 100 SMA is above the 200 SMA and moving farther away, indicating that bullish momentum is present. In that case, AUDUSD might still be able to bounce off the current support area to the next ceiling at .7250.

Event risks for this trade setup include the FOMC interest rate statement during which the Fed is expected to hike interest rates. This scenario has been priced in for a long time already, which means that there's a strong chance for disappointment and profit-taking.

Fed officials are likely to reiterate that their tightening process will be a slow and gradual one, downplaying market expectations of consecutive rate hikes next year. Aside from that, Fed head Yellen could reiterate that they can still undo their tightening moves if necessary.

Screen Shot 2015-12-15 at 3.57.30 PM.jpg

There are no major event risks lined up from the Australian economy, which means that commodity price movements might play a key role in pushing AUDUSD around for the rest of the week.

By Kate Curtis from Trader's Way
 

katetrades

Master Trader
Feb 11, 2013
2,557
8
84
Dominica
www.tradersway.com
USDJPY Retracement Setup (Dec 17, 2015)

USDJPY previously broke below a consolidation pattern visible on its 4-hour time frame then dipped to a low of 120.30 before showing signs of a retracement. Using the Fibonacci retracement tool on the latest swing high and low shows that the broken support lines up with the 61.8% Fib.

This also coincides with the 122.50 minor psychological mark and the moving averages, which usually hold as dynamic inflection points. The 100 SMA appears to be crossing below the longer-term 200 SMA already so the path of least resistance is to the downside.

Stochastic is already indicating overbought conditions so buyers might need to take a break and let sellers take over. Meanwhile, RSI is still making its way up so there may be a bit of buying pressure left before the oscillator reaches the overbought zone.

Fed policymakers decided to hike interest rates as expected to 0.50% while at the same time upgrading growth and employment estimates for 2016. Fed head Yellen expressed confidence in US fundamentals during her press conference and didn't sound too cautious.

Now that the FOMC statement has already played out, market watchers can turn their attention to the BOJ monetary policy statement on Friday. No actual changes are expected but the yen could react to any potential changes in rhetoric.

Screen Shot 2015-12-16 at 11.38.07 AM.jpg

Data from Japan has been coming in line with expectations recently so it's likely that the BOJ would retain their optimistic stance. Still, any hint of dovishness could be bearish for the yen and possibly allow USDJPY to break past the Fib levels.

By Kate Curtis from Trader's Way
 

katetrades

Master Trader
Feb 11, 2013
2,557
8
84
Dominica
www.tradersway.com
EURGBP Long-Term Range (Jan 4, 2016)

EURGBP is still inside its long-term range visible on the daily time frame and currently testing the resistance around the .7400-.7450 levels. If this area keeps gains in check once more, a move back towards the range support at the .7000 major psychological level could be seen.

Stochastic and RSI are both indicating overbought conditions, which means that buyers are already exhausted. This could allow sellers to take control and push for a selloff, especially since both oscillators are starting to move lower. However, a quick return in buying pressure might still pave the way for an upside breakout.

In that case, EURGBP could climb by around 400-450 pips, which is the same height as the rectangle formation. This could take the pair up to the .7800-.7900 area or much higher. The 100 SMA just crossed above the 200 SMA, suggesting that the path of least resistance is to the upside.

Event risks for this trade today include the release of the UK manufacturing PMI, which is expected to rise from 52.7 to 52.8 and possibly allow the pound to regain ground. German preliminary CPI and Spanish manufacturing PMI are lined up from the euro zone today.

160104_eurgbp.jpg


Spanish and German unemployment change figures are lined up tomorrow and these might serve as stronger catalysts for euro moves. Also due tomorrow the CPI flash estimate from the region which might have implications on future ECB action. On Wednesday, the UK services PMI is lined up and this is also usually a market-mover for pound pairs.

By Kate Curtis from Trader's Way
 

katetrades

Master Trader
Feb 11, 2013
2,557
8
84
Dominica
www.tradersway.com
NZDUSD Long-Term Downtrend (Jan 5, 2016)

NZDUSD has been trending lower on its weekly time frame, moving below a descending trend line connecting the latest highs of price action. Price is currently testing the downtrend line around the .6800 major psychological level and has confirmed a reversal candlestick pattern.

This trend line also lines up with the 38.2% Fibonacci retracement level on the latest swing high and low, adding to its strength as resistance. The 100 SMA is below the longer-term 200 SMA, indicating that the path of least resistance is to the downside. This might be enough to take NZDUSD down to the previous lows at the .6200 levels.

In addition, stochastic is already indicating overbought conditions on the weekly time frame and a turn lower could draw more sellers to the mix. RSI hasn't quite reached the overbought zone but is already moving south, indicating a buildup in selling pressure.

Event risks for this setup include the GDT auction in New Zealand, as a strong rise in prices could spur gains for the Kiwi. However, another sharp drop could suggest that the downturn in the dairy industry isn't over and that further declines are possible given the weak economic performance of China.

nzdusd2.jpg


As for the US dollar, the NFP report is coming up later on this week and weak jobs growth could cast doubts on the Fed's next rate hike this year. The ISM manufacturing PMI came in weaker than expected led by declines in hiring, which suggests that the NFP might disappoint. Still lined up is the ADP non-farm employment change and ISM non-manufacturing PMI.

By Kate Curtis from Trader's Way
 

katetrades

Master Trader
Feb 11, 2013
2,557
8
84
Dominica
www.tradersway.com
GBPAUD Descending Channel (Jan 6, 2016)

GBPAUD has been trending lower on its 4-hour time frame, moving inside a descending channel connecting the latest highs and lows of price action. Price just bounced off the bottom of the range and is now making its way to the top, which might continue to hold as resistance.

For now, though, the 100 SMA is holding as a near-term dynamic inflection point around the middle of the channel. If this is enough to keep gains in check, another move towards the channel support could be seen. This short-term SMA is below the longer-term 200 SMA, which suggests that the path of least resistance is to the downside.

Stochastic is already in the overbought region so bullish momentum could be weakening. In addition, RSI is nearing the overbought area so sellers may be ready to take control of price action soon.

Event risks for this trade setup include the UK services PMI release, as stronger than expected results could lead to a climb up to the channel resistance while weak data could lead to a move towards the bottom. Analysts are expecting to see a dip from 55.9 to 55.6, which would reflect a slower pace of industry expansion.

Earlier today, China reported a weak Caixin services PMI, following yesterday's downbeat manufacturing PMI release. This is at odds with the government readings released during the previous week, which indicated small improvements in both sectors. The services PMI fell from 51.2 to 50.2 to indicate a slower pace of industry growth, weighing on the Australian dollar and risk sentiment.

gbpaud.jpg


Aside from that, the recent selloff in Chinese equities is also weighing on overall market sentiment and the positively-correlated Australian dollar. Further declines are expected since the ban on short-selling of securities is set to expire by the end of the week.

By Kate Curtis from Trader's Way
 

katetrades

Master Trader
Feb 11, 2013
2,557
8
84
Dominica
www.tradersway.com
EURUSD Retracement Setup (Jan 7, 2016)

EURUSD has been trending lower on the short-term time frames, with a potential retracement opportunity presenting itself on the 4-hour chart. Price previously broke below support around 1.0850-1.0900 before dipping close to the 1.0700 handle then pulling back.

Using the Fibonacci retracement tool on the latest swing high and low shows that the 50-61.8% levels line up with the broken support zone. This might hold as resistance since it is also close to the dynamic inflection points at the moving averages.

In addition, the 100 SMA is below the 200 SMA so the selloff is likely to carry on. Stochastic and RSI are both indicating overbought conditions, which means that buying pressure is already exhausted and that sellers might take over, pushing EURUSD back to the 1.0700 area or much lower.

Data from the US economy came in mixed yesterday, as the ADP non-farm employment change report surprised to the upside while the ISM non-manufacturing PMI fell short of expectations. The FOMC minutes confirmed that members were seeing improvements in the labor market but were still uncertain about inflationary prospects.

As for the euro zone, services PMI readings also came in mixed but the strong figures were enough to inspire profit-taking off the euro short positions. German factory orders and retail sales are up for release today, with the former expected to show a 0.1% uptick and the latter likely to post a 0.5% gain.

eurusd.jpg


Only the initial jobless claims report is due from the US today, with traders likely holding out for the NFP report due tomorrow. A 203K increase in hiring is eyed, although market watchers might pay closer attention to the average hourly earnings figure, which might indicate a 0.2% gain.

By Kate Curtis from Trader's Way
 

katetrades

Master Trader
Feb 11, 2013
2,557
8
84
Dominica
www.tradersway.com
USDCAD Retracement Setup (Jan 8, 2016)

USDCAD has been breaking past one high after another in the past few days, as risk aversion and falling oil prices have weighed on the Canadian dollar. It seems that the pair has topped at around 1.4170 and may be ready for a pullback to an area of interest.

Applying the Fib tool on the latest swing low and high shows that the 50% level coincides with the broken resistance at the 1.4000 major psychological level. This is also close to the 100 SMA, which might hold as a dynamic support zone.

Speaking of moving averages, the short-term 100 SMA is above the 200 SMA so the uptrend is likely to carry on. Meanwhile, stochastic and RSI are both on the move down, indicating that the pair might still be in the middle of a correction.

Yesterday, the Ivey PMI release from Canada printed dismal results, as the index fell from 63.6 to 49.9 to indicate industry contraction. Analysts had only been expecting to see a drop to 56.7. In addition, oil prices have continued to tumble, putting additional downside pressure on the positively-correlated Loonie.

Later today, the US NFP report might yield big moves for this pair, as strong data could spur more gains for the US dollar. Market watchers are looking out for a 203K gain, slower than the previous 211K increase, although revisions could still be seen.

usdcad.jpg


Also due today is Canada's jobs report, which might indicate a 10.4K increase in hiring. Their jobless rate is expected to hold steady at 7.1% but weak figures could remind traders that the BOC might pursue another round of rate cuts to keep the economy afloat.

By Kate Curtis from Trader's Way
 
NZDUSD Long-Term Reversal Signal (Jan 11, 2016)

NZDUSD has formed a double top pattern visible on its daily time frame, hinting that a longer-term selloff is in the cards. The chart pattern is approximately 400 pips in height so the pair could be in for the same amount in losses.

Price has yet to break below the neckline of the formation around the .6500 major psychological level before confirming this potential drop. The 100 SMA is below the longer-term 200 SMA, which means that the path of least resistance is to the downside.

However, stochastic is already indicating oversold conditions so sellers might need to take a break soon. RSI is also nearing the oversold region, eventually drawing some buyers to the table or spurring profit-taking activity. For now, the 100 SMA also appears to be holding as a dynamic support zone.

Last week, jobs data from the US came in stronger than expected, as the economy added 292K jobs in December. To top it off, previous month's revisions amounted to an additional 50K in hiring gains. However, wage growth was absent in December, downplaying FOMC expectations that wage inflation could support consumer price levels.

In New Zealand, the GDT auction revealed another drop in prices, signaling that the downturn in the dairy industry isn't over yet. There are no major reports lined up from New Zealand this week, which suggests that the Kiwi might take its cue from Australian data and overall market sentiment.

160111_nzdusd_2.jpg


Over the weekend, CPI readings from China came short of expectations, keeping further PBOC easing expectations in play. Another round of losses in China's stock market could keep a lid on gains among commodities and comdolls.

By Kate Curtis from Trader's Way
 

katetrades

Master Trader
Feb 11, 2013
2,557
8
84
Dominica
www.tradersway.com
EURUSD Short-Term Selloff Signal (Jan 12, 2016)

EURUSD has been able to weather the market selloff pretty well in the past week, holding steady just above the 1.0850 minor psychological level even while other dollar pairs are plummeting. However, a short-term drop might be in the cards as a double top can be seen on the 1-hour time frame.

The pair has failed in its last two attempts to break past the 1.0950 minor psychological mark and has found support at the 1.0800 neckline. A break below this level could confirm that a selloff is underway, possibly taking EURUSD back to the previous lows at 1.0700 or much lower.

The 100 SMA is still below the 200 SMA on the 1-hour chart but looks prime for an upward crossover, which means that another bounce could be possible. In that case, price could still make another test of the 1.0950 resistance or possibly break above it. Stochastic is moving up from the oversold area, hinting that buyers are taking control of price action.

Event risks for this trade setup include the US retail sales and PPi reports due later on in the week. Last week's jobs data turned out mostly stronger than expected, although wage growth was absent. Nonetheless, the December consumer spending report could be lifted by holiday shopping and might beat expectations.

As for the euro, economic data has been mixed lately, but the shared currency has drawn support from funds flowing out of China and into the European markets. There are no major reports due from the euro zone today, as the next catalyst might be the ECB minutes due on Thursday.

160112_eurusd.jpg


Risk sentiment could still play a key role in price action moving forward, particularly the behavior of Asian financial markets. Another weak performance out of China could spur more declines in global equities, leading traders to buy up the safe-haven US dollar.

By Kate Curtis from Trader's Way
 

katetrades

Master Trader
Feb 11, 2013
2,557
8
84
Dominica
www.tradersway.com
AUDUSD Daily Range Support (Jan 13, 2016)

AUDUSD is currently bouncing off the bottom of its long-term range visible on the daily time frame, partly supported by the pickup in risk sentiment and stronger than expected data in China. The pair has found support at the .6950 minor psychological level and climbed back above .7000, possibly setting its sights on the top of the range near the .7400 major psychological level.

However, the 100 SMA is still below the 200 SMA for now, indicating that the path of least resistance is to the downside and that a break lower might still take place. Stochastic just reached the oversold area and is starting to turn higher, which suggests that buyers could gain the upper hand soon. A break below the range support could take AUDUSD lower by around 400 pips, which is the same height as the rectangle formation.

There have been no major reports out of the US lately, as it looks like the return in risk appetite is limiting the safe-haven currency's gains. Catalysts lined up include the retail sales, PPI, and consumer sentiment index on Friday.

160113_audusd.jpg


Earlier today, China released a stronger than expected trade balance, as the surplus widened from 343 billion CNY to 382 billion CNY, buoyed by a 2.3% gain in exports. Although imports fell by 4%, this was better than the projected 7.9% tumble. On Thursday's Asian session, Australia will release its employment report and possibly show a larger gain in hiring.

By Kate Curtis from Trader's Way
 

katetrades

Master Trader
Feb 11, 2013
2,557
8
84
Dominica
www.tradersway.com
USDJPY Complex Head and Shoulders (Jan 14, 2016)

USDJPY could be in for a long-term selloff, as the pair has formed a complex head and shoulders pattern on its daily time frame. Price is still hovering around the neckline around 117.50-118.00, with a downside break likely to confirm that further losses are likely.

If that happens, USDJPY could fall by an additional 800 pips, which is the same height as the chart formation. This could take it down to the 110.00 levels or much lower, although near-term support areas could trigger profit-taking activity.

The 100 SMA just crossed below the longer-term 200 SMA, confirming that the path of least resistance is to the downside. However, stochastic is already in the oversold zone, which means that sellers are exhausted and might allow buyers to take over. If so, a bounce back to the nearby resistance at 120.00-121.00 is possible.

Earlier today, Japan printed a couple of weaker than expected economic reports. Core machinery orders fell by 14.4% while the Japanese PPI indicated a 3.4% decline in producer price levels, hinting that weaker price pressures are to be expected.

Coming up, Japan is set to print its preliminary machine tool orders report. Another downbeat result could still keep the yen supported, as risk sentiment appears to be driving its price action.

160114_usdjpy_14_01.jpg


As for the US initial jobless claims and a speech by FOMC member Bullard are lined up today. Tomorrow, retail sales, PPI, and consumer sentiment data are due.

By Kate Curtis from Trader's Way
 

katetrades

Master Trader
Feb 11, 2013
2,557
8
84
Dominica
www.tradersway.com
EURGBP Ascending Channel (Jan 15, 2016)

EURGBP recently broke above the top of its long-term range, indicating that a longer-term climb is in play. Zooming in to the 1-hour time frame shows that price is moving inside an ascending channel and is currently testing support.

A bounce off this area, which is just above the short-term 100 SMA and .7500 major psychological level, could take EURGBP up to the top of the channel at the .7700 major psychological resistance. A larger pullback, on the other hand, could lead to a test of the broken long-term range resistance at .7450 near the 200 SMA.

The 100 SMA is above the 200 SMA, indicating that the path of least resistance is to the upside. In addition, stochastic is moving out of the oversold zone so sellers are taking control of price action. A break below the 200 SMA might be a sign that the pair is ready to get back inside its long-term range with support at .7000.

The BOE sounded less upbeat in their statement yesterday, reiterating that the downturn in oil is likely to weigh on their inflation outlook. Wage growth still remains weak, putting little upward pressure on inflation and consumer spending.

The ECB minutes did very little to dull the euro's shine even though this meeting resulted to an expansion of the central bank's stimulus program. Data from the euro zone has been mixed lately, although there have been signs of resilience. Also, the shared currency is gaining ground from China outflows.

160115_eurgbp_15_01.jpg


Only medium-term reports are lined up from the euro zone and the UK today, which suggests that the current trend might carry on or that consolidation could be in order.

By Kate Curtis from Trader's Way