Horizontal Channel (Rectangle) Pattern
Contents
What is a channel?
A channel is a popular tool that helps to better identify a trend and predict price actions. It is a chart pattern also known as a parallel channel or equidistant channel and that consists of two parallel lines that connect consecutive highs and lows and contain prices between them. Channels are divided into three categories depending on the direction of the price move within the pattern and the angle of the channel. Those categories are an upward-tilted ascending channel, a downward-sloping descending channel, and a horizontal rectangle channel. Here you will learn details about a rectangle channel pattern.
What is a rectangle (horizontal) channel?
A rectangle channel, also sometimes called a box pattern or a horizontal channel, consists of two parallel lines that are drawn across consecutive pivot highs and pivot lows and indicate levels of support and resistance. It occurs when prices do not show a clear trend. Therefore, it is usually considered to be a neutral pattern, though some analysts distinguish bullish and bearish rectangles depending on the direction of the price movement before the pattern had been formed. Most analysts think that the rectangle channel shows indecisiveness of traders and a period of consolidation. Some analysts also think that the pattern shows a balance between supply and demand.
How to construct a rectangle channel?
The pattern is drawn with the higher line touching at least two consecutive highs and the lower line touching at least two consecutive lows. The more highs and lows the lines touch the more certain the pattern is. Usually, prices move within the channel, though sometimes they can move outside of the channel for a short while. Traders should be cautious of such false breakouts. Yet a real breakout can be considered a strong buy or sell signal. An upward breakout is a bullish sign, while a downward breakout is a bearish sign.
How to trade a rectangle channel?
There are two main strategies involving the rectangle pattern: to bet on prices staying within the channel or to wait for a breakout. In the former case, traders can buy at the floor and sell at the ceiling, expecting prices to bounce between the borders of the pattern.
Yet trading breakouts is more popular. A breakout can occur in any direction. Yet many analysts consider the rectangle to be a continuation pattern. That means more likely than not prices will continue to move in the previous direction after taking a breather for a while. Therefore, it is considered safer to buy upside breakouts if prices were moving up before the pattern occurred and sell if prices were moving down before the period of consolidation. Yet it is important to remember that there is always a chance that the particular rectangle will turn out to be a reversal pattern after all. In any case, our usual trading advice for trading patterns applies here as well: to enter a position at 10% of the channel's height off the rectangle's border and to set your profit-taking objective at the channel's height above or below the rectangle (depending on whether you buy or sell). Traders should be wary false breakouts. To avoid them, it is a good idea to use other technical indicators, like MACD or RSI. Traders may also require that a significant increase in volume should accompany a breakout.
Rectangle channel examples
Here are two examples of trading using rectangle channels in the real world, one which led to successful trade and another one that did not.
The first example shows a rectangle channel (indicated by the yellow lines), which had formed on the longer-term weekly chart of GBP/CHF in January 2021. Betting on an upside breakout, an entry point for a long position was set above the upper border at the level indicated by the cyan line, while the green line shows the intended profit-taking objective.

A successful upside breakout triggered a long position after about a month after the pattern had been identified.

The breakout turned out to be very strong as prices moved directly to the profit-taking objective without any pause.

Another example shows a less successful trade. A rectangle had formed back in September 2013 on the daily chart of AUD/JPY.
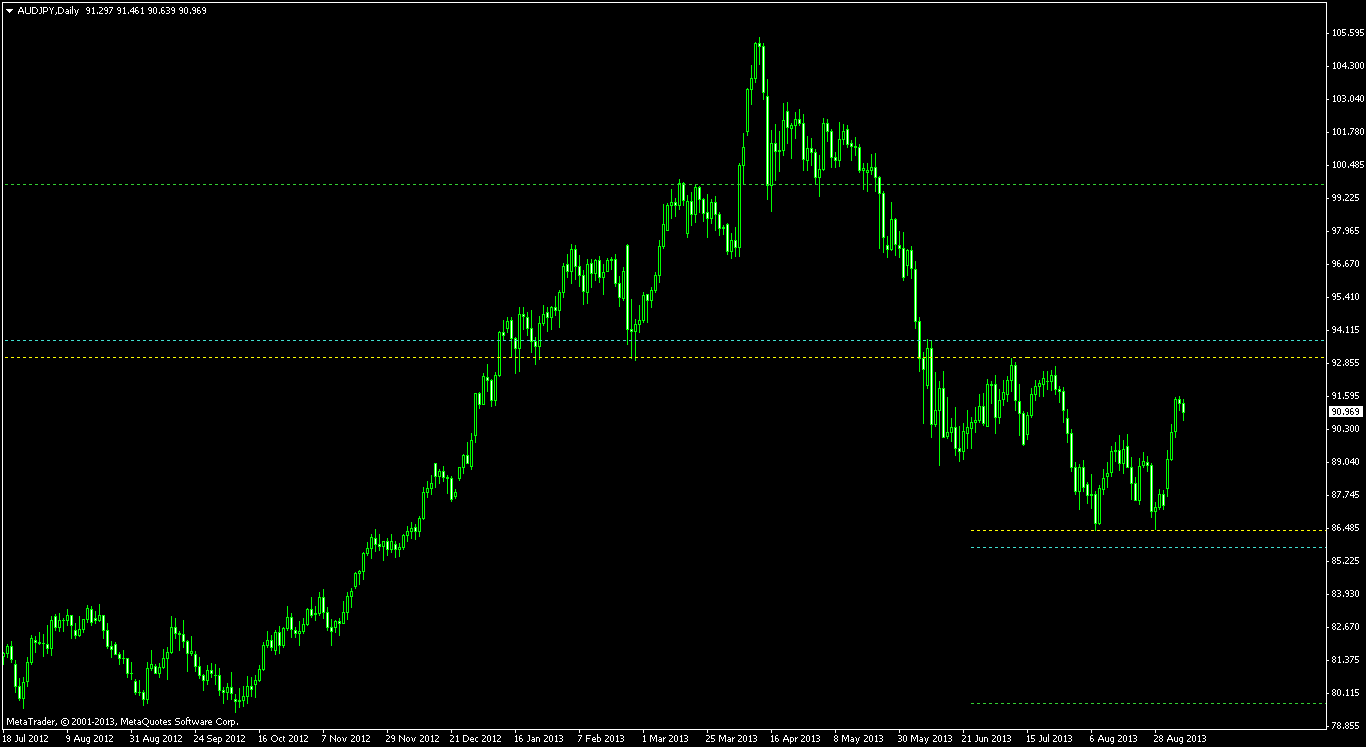
An upside breakout triggered a long entry position.
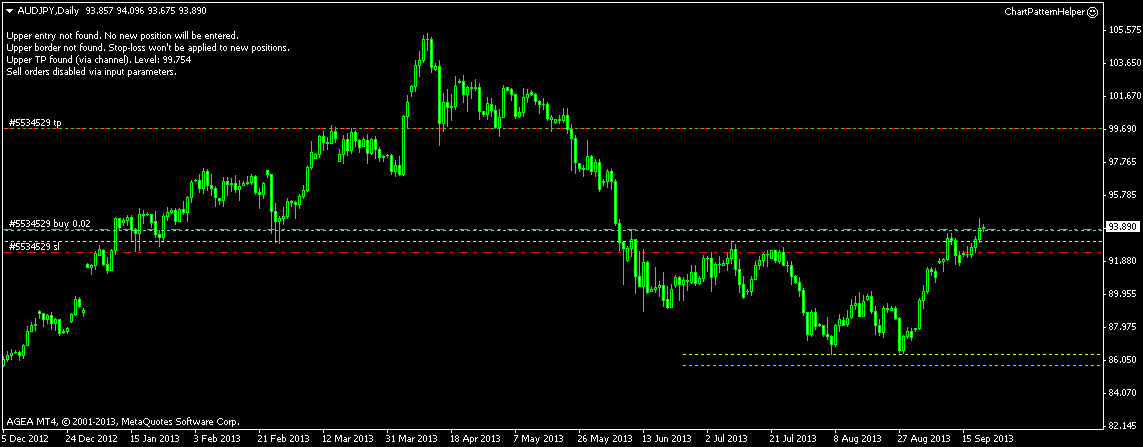
Yet a breakout was followed by a retreat back into the channel.

Conclusion
A rectangle channel is a good tool for identifying a period of consolidation and a moment when the previous trend can potentially resume. Yet as shown in the examples above, a false breakout can be a danger and hurt a trader. Therefore, as with any technical indicators, a rectangle should not be used as the only tool but rather together with other technical indicators and/or fundamental analysis.
If you have some questions about horizontal channels (rectangles) or using these chart patterns in Forex trading, you can ask them on our forum.
If you want to get news of the most recent updates to our guides or anything else related to Forex trading, you can subscribe to our monthly newsletter.